In Canada we call the people who spend the winter months in Florida “snowbirds”, but it would probably make more sense if they went someplace that actually had snow. Like Cambridge Bay, Nunavut, for instance, this week’s stop on our tour of the sunburnt lands up north. As always we are looking for signs of that blistering winter warming that governments like to show in their coloured maps of climate change. But it turns out that if you’re looking to like totally chill, man, Cambridge Bay is for you. Here are the annual January average daytime highs since 1940. Yes. Way down there at the bottom.
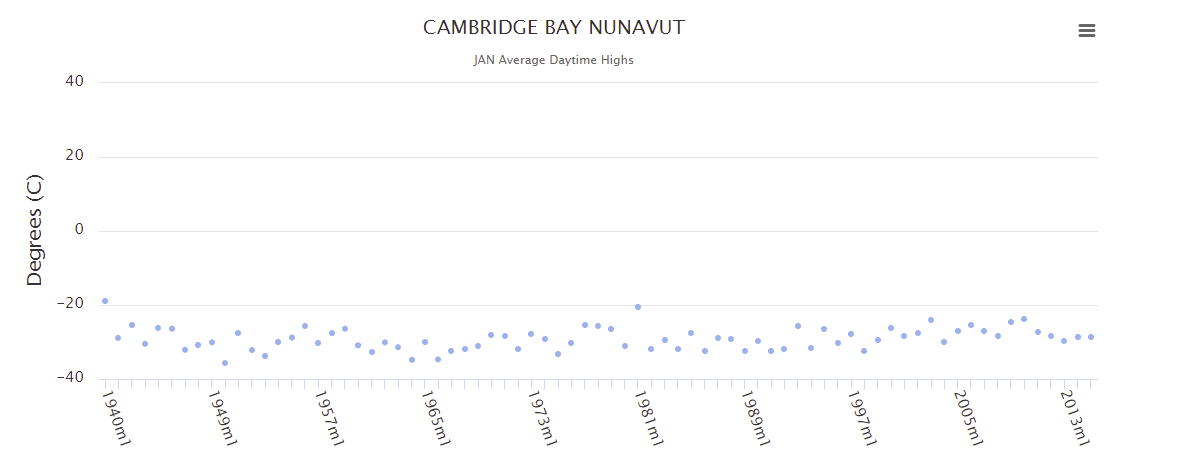
No luck on the other hand if you’re after warming. Now here's February.
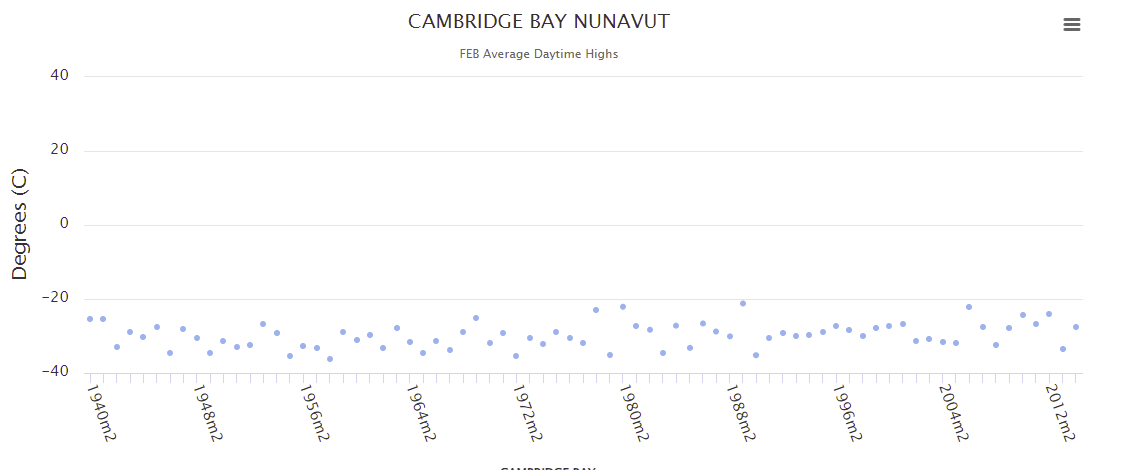
Which looks a lot like January, with the mercury stuck around -30C. As for March:
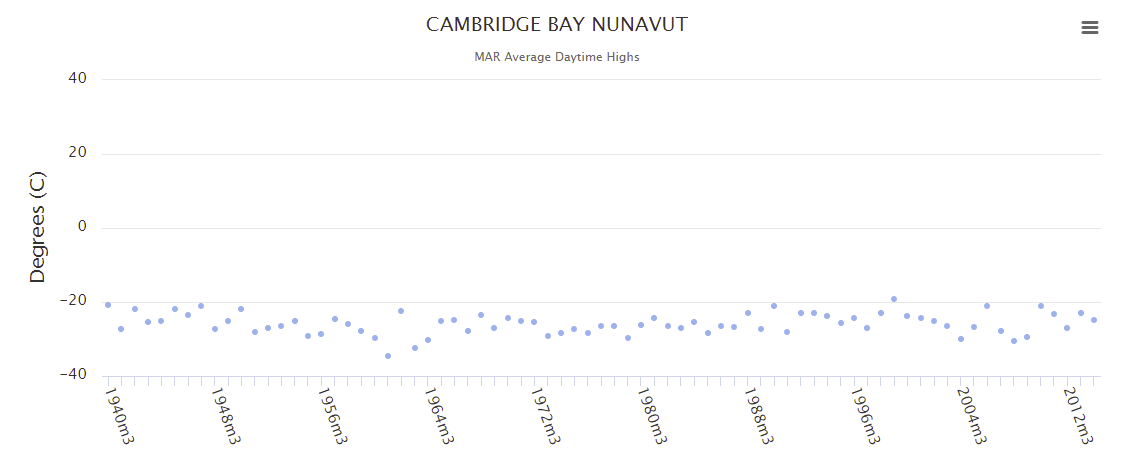
Ahh it’s a balmy -25C or thereabouts. Which is OK if you like stark, minimalist beauty. But if it’s warmth and sunshine you want, you’re about 50 degrees (C) in the wrong direction.
See Comments 
The sunburnt lands up north: Cambridge Bay
02 Mar 2022 | Science Notes


The UK Government apparently believes that the world will overheat through climate change, caused by increases in carbon dioxide gas in the atmosphere. The latest report (AR6) from the Intergovernmental Panel on Climate Change has just been published and, at 3,675 pages, if ever there were an attempt to blind laymen with verbiage, this is it. They do however provide a 37-page Summary for Policymakers. IPCC_AR6_WGII_SummaryForPolicymakers.pdf Para A.1.1. summarises the observed rise in CO2, which I accept, although there are other explanations than mankind’s use of fossil fuels. Para A.1.2, which I reproduce below, obfuscates the purported effect on the Earth’s temperature, which is what they are trying to scare us about.
A.1.2 Each of the last four decades has been successively warmer than any decade that preceded it since 1850. Global
surface temperature8 in the first two decades of the 21st century (2001–2020) was 0.99 [0.84 to 1.10] °C higher than
1850–1900.9 Global surface temperature was 1.09 [0.95 to 1.20] °C higher in 2011–2020 than 1850–1900, with larger
increases over land (1.59 [1.34 to 1.83] °C) than over the ocean (0.88 [0.68 to 1.01] °C). The estimated increase in
global surface temperature since AR5 is principally due to further warming since 2003–2012 (+0.19 [0.16 to 0.22] °C).
Additionally, methodological advances and new datasets contributed approximately 0.1°C to the updated estimate of
warming in AR6.
To summarise, what this says is that:
• The average temperature from 2001 to 2020 is 1oC higher than the average from 1850-1900.
• The average temperature from 2011 to 2020 is 1oC higher than the average from 1850-1900.
In other words, there has been no significant increase from 2001-2010 to 2011-2020. A tenth of one degree is well within the margin of error. No sceptics would challenge this and, indeed, we accept that global temperatures have risen since the ending of the Little Ice Age (circa 1300 to 1850), which followed the Medieval Warm Period, when temperatures were even higher than today. There is a false correlation with rising CO2 and no evidence of man-made warming and that, in any case, the last ten years has seen no appreciable warming. There is no ‘Climate Emergency’ requiring hair shirt policies for decarbonising our energy and imposing unacceptable and pointless costs on the consumer