Thanks for the leads for our new “Everybody Knows” series, where each week we look at an alarmist claim in the media that is presented as so self-evidently true that nobody, least of all a journalist, should bother checking whether it is supported by any evidence. This week alert reader Gary Puckering noted an August 16 story on the CBC about a heatwave coming on the Canadian prairies “with temperatures forecasted to exceed 30 C, triggering heat warnings”, which sounds pretty bad, and a harbinger of worse to come because of you-know-what: “A heat wave is building across the Prairies and climate change means we can expect more.” But are summertime temperatures above 30° C unusual? There are records of daily temperatures on the Canadian prairies at least back to the 1940s, and to the late 1800s in some places, so we checked.
Puckering pointed us to the weather station at Estevan, Saskatchewan, where the thermometer is, to this day, located well away from built-up areas so it should provide a good record of prairie conditions, at least in southern Saskatchewan. The main Environment Canada record goes back to 1944 but the historical archive contains records back to 1900. And Puckering had this to say about the post-1944 data:
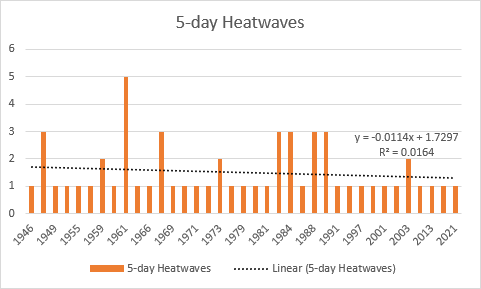
For the purposes of this exercise, I looked for consecutive 3 and 5-day periods when the temperature was 30 C or higher.
I found 27 years where there were heatwaves lasting 5 days or more. And I found 7 years where there was more than one, the worst being 1961 when there were 5. In fact, with the exception of 2003 when there were two 5-day heatwaves, there has only been one per year since 1991.
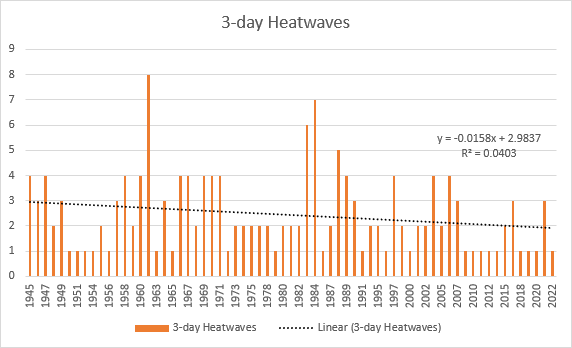
As for trends, they are downward for both 5 and 3-day heatwaves per year:
The other metric I analyzed is the number of days for each heatwave. For heatwaves lasting 3 days or more, here’s what that looks like:
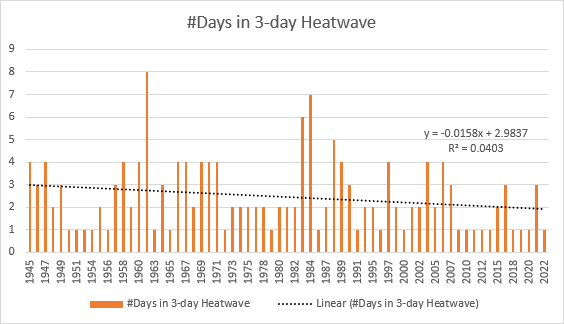
Once again, we have a downward trend. Heatwaves have been getting shorter.
The article quotes an IPCC report saying the heatwaves are likely to become more common. I’ll acknowledge that the report does say that, though it’s based on models that so far are proving to be pretty inaccurate. But the author said that heatwaves are becoming more common. Well, not in Estevan they aren’t. My guess is the only places they are becoming more frequent are at the airports and downtown centers.
So how about Manitoba? I found one station with data stretching from 1915 to 2022. It has a few summer gaps in 2008-2009 but is otherwise pretty complete for the purposes of heatwave analysis: Indian Bay, station CA005031320 at coordinates 49.6167 N 95.2 W. Here’s what its 3-day Heatwave chart looks like:
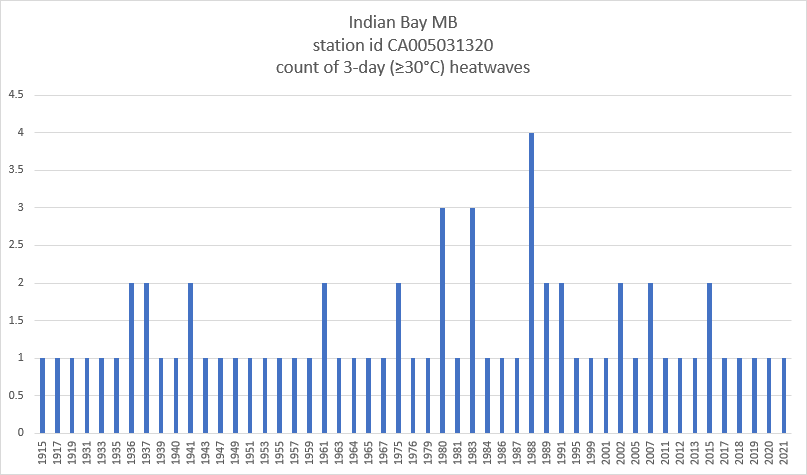
Obviously 1988 was a hot year, with 4 three-day-or-more heatwaves. But since then it’s been pretty normal, at around one per year, sometimes two.
If we sum up the number of days for all the 3-day-or-more heatwaves each year, we get this picture:
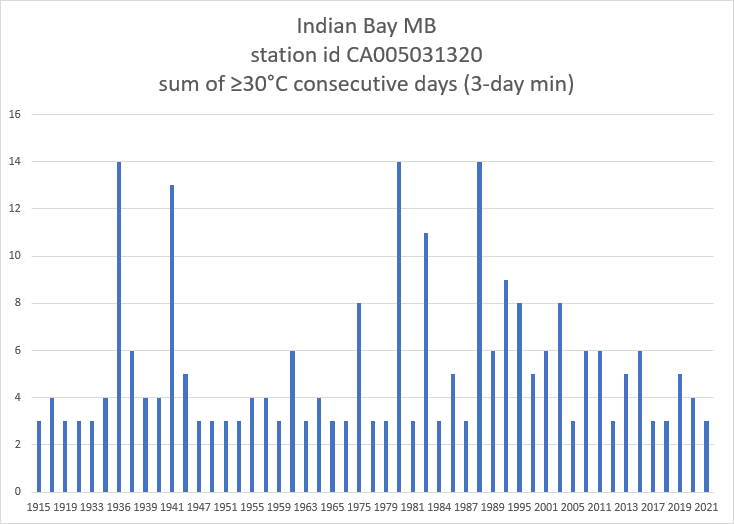
Ok, so that’s obviously been trending downward this century.
Back to the CBC scare story, after August 16 the ensuing 5 days reached highs of (in deg C) 28.0, 27.8, 29.2, 28.0 and 27.7, none of them in heat wave territory. The 21st of August finally broke 30 degrees, reaching a blistering 31.4 degrees, before falling back to 29.4 C the next day. The horror! A one-day heat wave.
In fairness July was a bit worse, with a 3-day stretch above 30 degrees, peaking at 34.1 degrees C. But as Puckering shows, summer days above 30C are an annual occurrence. And with a very small amount of digging we found the pre-1944 Estevan climate record. Here are just some of the heatwaves, noted by the number of consecutive days in July above 30 degrees and the maximum reached:
July heat waves:
1906: 5 days (32.8)
1910: 3 days (36.7) then 6 days (32.2)
1914: 11 days (37.2)
1916: 7 days (32.8)
1918: 3 days (36.7)
1919: 3 days (38.9)
1920: 8 days (35.6) followed by 3 more days (31.7)
1921: 5 days (35.0)
1923: 3 days (31.7)
1925: 6 days (38.9)
1935: 6 days (37.8)
The gap from 1925 to 1935 doesn’t mean there wasn’t a heat wave, the data just aren’t available. And the lack of records after 1935 doesn’t mean there weren’t heat waves, we just got bored doing the CBC reporter’s job for her.
To send us another entry for Everybody Knows, email us at admin@climatedn.com.


Thanks for posting my contribution!
Unfortunately one of the charts I submitted was a duplicate. The chart titled #Days in 3-day Heatwave is identical to the previous one titled 3-Day Heatwaves. The latter is a count of the heatwaves each year. The former was supposed to be a total of the number of days in each heatwave. Fortunately, it doesn't affect the bottom line: the trend is downwards, even more steeply than the (incorrect) chart indicates.
I don't know how I overlooked the earlier station (called Estevan, rather than Estevan A). My bad. Anyway, I reran the analysis with both stations so as to have data from 1900 to 2022 and the 3-day heatwave count, as well as the sum of days in each heatwave, still have downward trends.
Mind you, none of these trends are statistically significant. And that's really the main point, isn't it? Any article claiming heatwaves in an area should base that statement on some statistically significant trend. Five-day heatwaves are so rare in the prairies that it isn't even useful to measure them for trend analysis. Three-day heatwaves are more common, but about the most accurate thing you can say about them is that there are about 2 per year, plus or minus 1. Occasionally there are 4. Very rarely, there 5 or more.
Another interesting observation from the Estevan stations is that the maximum temperature within the heatwaves has been trending downwards too, though it is slightly upward this decade and this century. Once again, the trends are not statistically significant.
Good work. This sort of information needs to somehow get out to the masses to slow down or stop the climate change mass hysteria.
Great work. Did you let CBC know of their mistake? If they were, they should do a full article on the error and how news agencies must be more careful in their research and wording. In fact predicting future weather with computer models and assumptions is not news and should not be reported by news agencies.
Not news, nor is it science either. Having worked modeling, both developing and VV&A, models basically reflect the underlying hypothesis, and give the results desired by the modeler. If you think carbon dioxide has a large effect on temperatures, and you predict that the rising temperatures will cause more extreme weather (note it is predict, not know) then your model will show exactly that. Modeling isn’t science; and unless you can show the model has been vigorously VV&A’d with real world data, it isn’t even a particularly useful engineering exercise. And models should never be used to shout down debate, and the results of modeling should never be included in a news story without a detailed discussion, up front on the assumptions made and the supporting data or lack there of, and the limitations of modeling in general.
I believe that the Climate activists in CBC Toronto think the prairies is a waste land where the temperature never rises above 20C. They have never traveled west of the Toronto airport and read there colleagues similar post and they feed off that as opposed to real data.