Little-noticed in last year’s release of the IPCC 6th Assessment Report was an online Atlas which provides a quick overview of their findings on available climate observations in recent decades. With all the talk of European heatwaves and drought, the IPCC report is as good a place to start as any. With a few clicks of the mouse we can select “hydrological drought” (i.e. dryness caused by lack of rainfall) and “past trends” as opposed to model projections. And what they find for western Europe is... nothing.
The map of the world they draw looks like this:
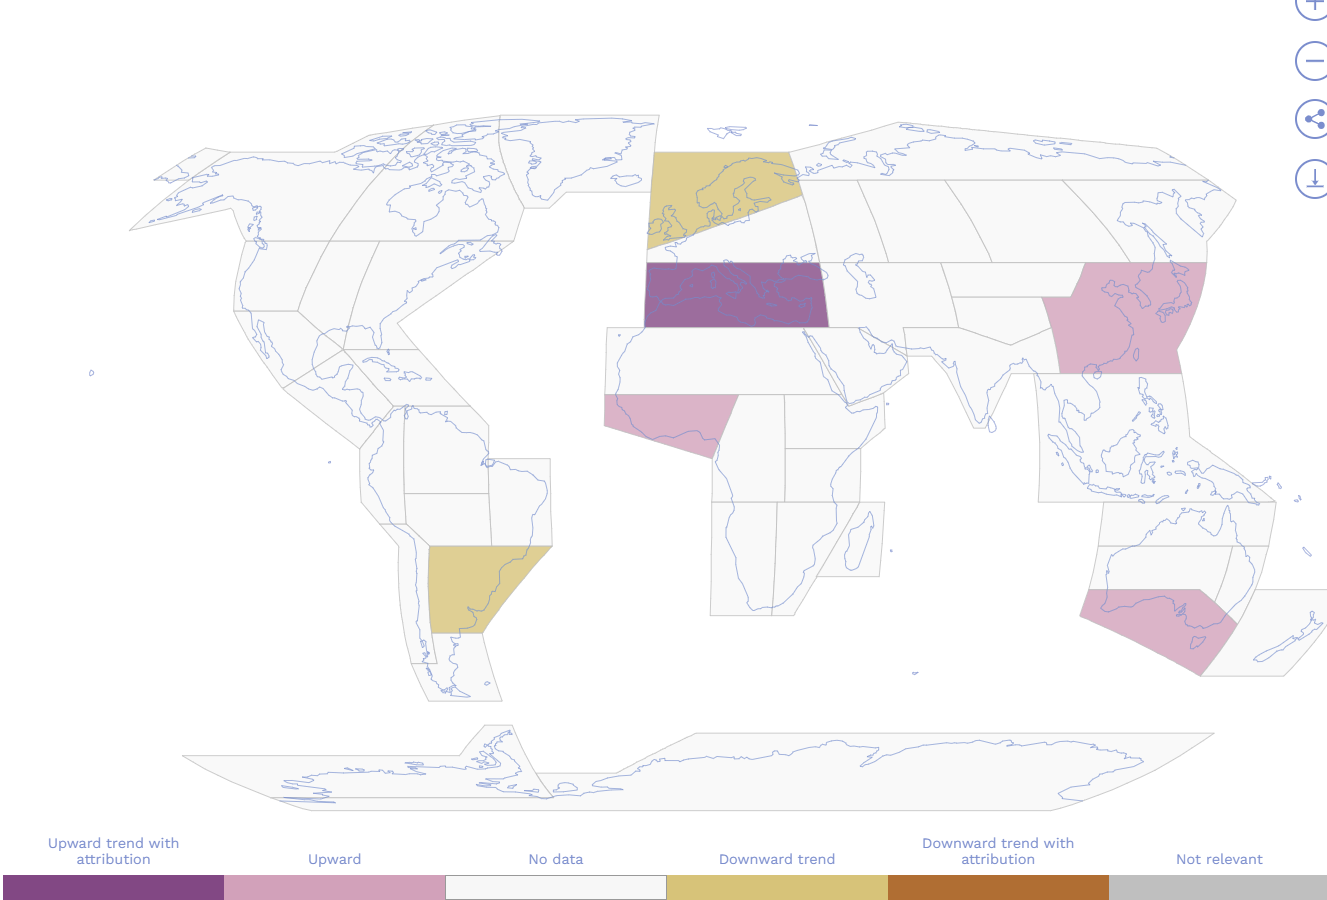
Where there is no colour they have no evidence of a trend one way or the other. Light yellow means decline and light pink means an increase with no claims of attribution to Greenhouse Gases. Purple means an upward trend that they attribute to anthropogenic causes. Zooming in on Europe we get:
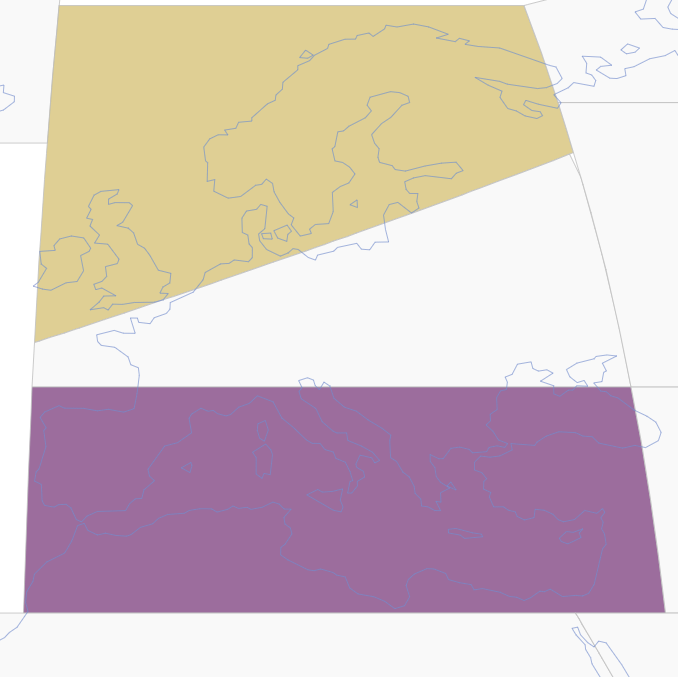
In Northern Europe they observe an unattributed tendency for less drought. In the Mediterranean they observe more frequent drought and they say it must be your fault. In the middle they find rien, nichts, and nic. In other words, nothing. Isn’t that something. No tendency in the historical record for more drought. At least according to the IPCC, those notorious deniers.


