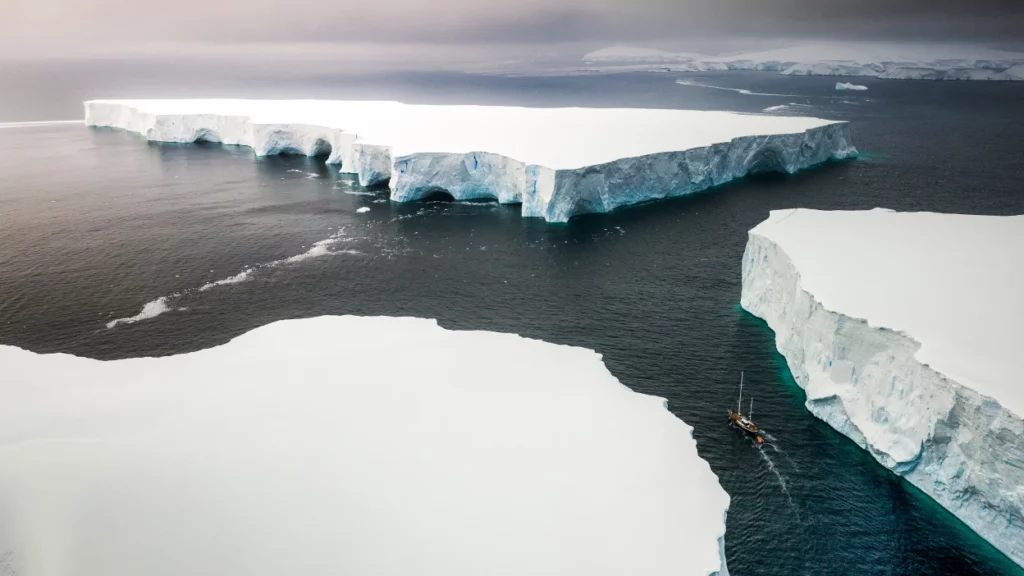
“Eureka!” comes a cry from the LGP about the MIP. And we perceive that you are fascinated. MIP is the “Missing Ice Problem” which is, uh, a problem involving missing ice. “Geological evidence from ocean areas suggest[s] that sea level might have been 120-140 m lower than today during the last Ice Age 20,000 years ago. The uncertainty of these data is quite large, though. To account for these low sea levels, as much as twice the current mass of the Greenland ice sheet would have to have been frozen worldwide. However, these glacier masses could not possibly have been that large at the time, according to climate models. Also, there is no geological evidence at higher latitudes for such a large mass of ice.” And LGP is the Last Glacial Period. But never mind the BNP (Boring Name Problem). The point is that from the heart of the DSS (Department of Settled Science) we learn that nobody understood why the oceans, or the glaciers, did what they did last time the former were smaller and the latter were bigger during the LGP. Or even what they did. But now another computer model says “Eureka” in a tinny voice and a human voice, belonging to Dr Paolo Stocchi of The Royal Netherlands Institute for Sea Research, adds, “Our new reconstruction revolutionizes what we thought about the global continental ice mass during the Last Ice Age. The total mass of the Last Ice Age glaciers was 20% smaller and accumulated faster than previously thought.” And now we understand everything and can model it to bits.
It’s a bit funny when you think of all those maps of ice age glaciers you saw in high school or possibly on Wikipedia or those reconstructions showing how thick the ice was over your city during the LGM (Last Glacial Maximum, but enough with the TLAs). It turns out it was all wrong. Not wrong as in actually-there-was-no-ice-age wrong, or the-cold-stuff-started-at-the-equator wrong. Just wrong as in we had the general idea right but the size and timing wrong. Which means the analogies we drew from it were not very reliable. And scientists have known for a long time that they had a problem, namely a MIP.
Don’t take our word for it. From “Eureka” or rather EurekAlert!, where this and many other FPRs (Fascinating Press Releases) are found, “With new calculations that take into account crustal, gravitational and rotational perturbation of the solid Earth, an international team of climate researchers has succeeded in resolving the discrepancy, among them Dr. Paolo Stocchi from the Royal Netherlands Institute for Sea Research (NIOZ). The study, now published in the journal Nature Communications, could significantly advance research into the climate of the past and help to make better sea-level predictions for the future.”
Better? Better than what? We keep being told the science is settled, Miami’s gonna get it and so will Bangladesh, it’s accelerating just exactly as the models predicted and faster than anyone thought possible and so on. And now this?
Yes. This. As in real science. And also, let’s not forget, as in a computer model. The press release reminds us, and it’s both basic and welcome, “this look into the past is difficult because the thickness of the glaciers and the height of the sea level can no longer be measured directly in retrospect.” And there’s more. Or if you prefer less: “Climate researchers therefore have to laboriously collect clues that can be used to reconstruct the past. However, depending on which clues you collect, the results are different and seem to contradict one another.” What? The evidence is fragmentary and contradictory? Why wasn’t Al Gore told? What else doesn’t he know?
Let’s be fair to the scientists. They knew about the MIP, hence its name, and they were working on it. It’s the “scientists say” crowd that either didn’t know or didn’t tell. And now the scientists throw a monkey wrench into other people’s labs too. “‘The isotope model has been used widely for years to determine the volume of ice in glaciers up to many millions of years before our time. Our work now raises doubts about the reliability of this method,’ says Paolo Stocchi.” And those isotope proxies are pretty important. So more uncertainty?
Perhaps not. To hear the proud parents tell it, the new model explains everything. “How steep were the mountain slopes? Where did glaciers reach the sea? Did friction interfere with ice flow velocity? And how much? The new model includes all these local factors. It also accounts for ice- and water-load-induced crustal deformations.” This time for sure.
According to the new research, “the sea level must have been around 116 meters lower than today at the time. There is no discrepancy in terms of glacier mass.” Which is nice, although we trust they won’t stop working on the issue because, well, the science isn’t settled. It’s just one computer model. But if it is correct, then we have to raise the seas retrospectively by between 4 and 24 metres. And the latter figure is quite large, over 1/6 of the total difference from today. So that means the rate of sea-level rise thousands of years ago must have been different than we thought. And perhaps, who knows, more recently too.
Dr. Stocchi’s “goal now is to use the new model to quantify the current rates of crustal deformation in the North Sea and Wadden Sea, thus revealing the actual contribution of current climate change to the regional relative sea-level changes.” Which we don’t currently know. Surprise!


Is it really coincidence that this article comes directly after "Independent research?" in "Your Wednesdayakeup from the Climate Discussion Nexus"? It would appear to me that computer modelling is the ultimate in confirmation bias.
We still don't know an awful lot about how much the ice sheets compress the underlying land mass or continent into the earth's mantle, or the possibility of a tilt in a landmass such as North America when the north end is under ice cover and the southern end is not.
This seems akin to the hockey stick graph Michael Mann fraudulently created.. Since they couldn't get the data to confirm their theory, they needed to erase the heat of the 30's and 40's, and the cooling of the 70's(??) to get the graph to work.. Not to mention the little ice age and warm period prior..