Willis Eschenbach also noticed those stories about the melting ice caps. And he went and got the data and created some charts worth 25 gigatonnes of words. Because while it’s possible to blow up the Y axis and make the line plunge to our dooms like a walrus fleeing a polar bear, if you chart the total ice mass you get a flat line. As in nothing to see.
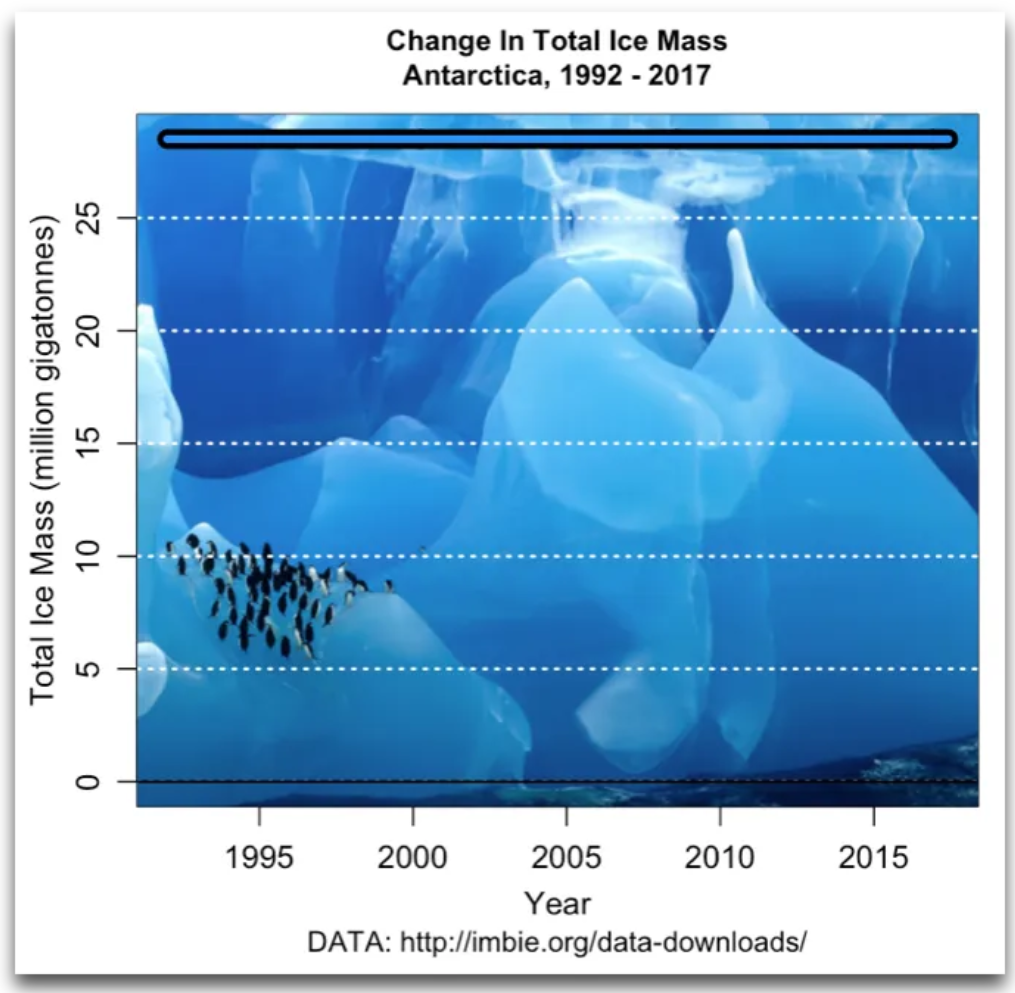
Image courtesy of Willis Eschenbach and Watts Up With That
Which is all you need to see.
Compressing or expanding the Y axis is one of the oldest tricks in the statistical book. (That book being, of course, Darrell Huff’s classic How to Lie With Statistics.) Which means the people making the charts in Nature magazine that got NBC and the Guardian so excited know all about it. And in his piece Eschenbach also creates alarming charts that show cumulative ice loss from top to bottom of the frame so it seems that we’re doomed. In fact he presents those ones first, for Antarctica and Greenland, and comments “YIKES! The ice loss looks like it’s falling off of an ice cliff … So those agree with the [Nature] study, and they are both adequately terrifying.”
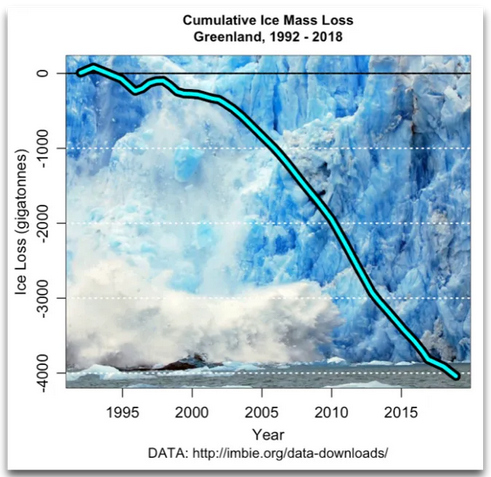
Image courtesy of Willis Eschenbach and Watts Up With That
As John Stuart Mill famously said, “He who knows only his own side of the case knows little of that.” Eschenbach knows both, unlike the journalists cited above. And he then goes on to discuss the other side of the story.
“Having seen that,” he writes of the scary charts, “I thought ‘how does this compare to the total ice mass in the Greenland and Antarctica ice sheets?’ Their ice volumes are not exactly known but are on the order of thirty million cubic kilometres in Antarctica and a tenth of that, three million cubic kilometres, in Greenland. Now, one cubic kilometre is about 0.95 gigatonnes of ice. Using those figures, I added the monthly Greenland ice mass loss shown in Figure 4 to the total mass of the ice in Greenland. That gives me the monthly total amount of Greenland ice.” And then he does a chart for Greenland where the lines does exactly what the line above does for Antarctica… runs flat across the top. Because the net change over 25 years is “about five-thousandths of one percent (0.005%) of the total Greenland ice mass per year … be still, my beating heart.”
He goes on to make a number of other highly pertinent points, including that “in fits and starts, the polar ice caps have been melting since we came out of the last glacial period … so the effect of polar meltwater is not new. Meltwater has been included in the sea level rise data for centuries. And as I’ve shown here [his link], we’re not seeing any acceleration in the rate of sea-level rise in the longest and best tide gauge records we have.” And again we feel obliged to state that the authors of the Nature study know these things, even if the journalists at NBC and the Guardian have somehow managed to remain so ignorant that they genuinely do not.
The final thing from his article that we want to highlight, and please go and look at his chart, is that he combines Antarctica and Greenland because “Size matters” and Antarctica is bigger and in doing so shows that, as we mentioned in our post "Drowning in numbers", the essentially trivial loss of ice mass from the early 1990s through about 2011 subsequently… reversed. Yes, reversed. For the past decade the ice loss has been decreasing. As to why, he speaks words of humble wisdom.
“We don’t know. Oh, they tell you in the studies that it’s from ‘ocean-driven melting’ or the ‘North Atlantic Oscillation’ or ‘ atmospheric circulation favoured cooler conditions’ or that the ‘spatial pattern of accelerating mass changes reflects the geography of NAO-driven shifts in atmospheric forcing’ … but those are just mechanistic correlations and relations. When they say ‘ocean-driven melting’, they’re just saying that when the water is warmer the ice melts more. Which is trivially true, and doesn’t answer the simple question—why did the trend reverse nine years ago, and not eleven years ago, or seven years ago, or not at all? We don’t know.”
Seems climate is complicated. But honest graphing is not, and those who know better should be ashamed of themselves. As, frankly, should those who do not and report on it anyway.


The natural question that comes up is, "Why would they lie?" Of course, "they" in this case is a fairly broad cast of characters. The reasons are the usual suspects - money, power, and fame. In the meantime, common folk, who ought to have learned by now to be a little more skeptical, start hyperventilating over this kind of "news." The good news, I think (besides the fine work done by folks like you), is that many common folk are very skeptical. Unfortunately, most don't like to get into conversations about this stuff because they're not keen on dealing with people who not only don't seem to have any common sense but who will berate you to the ends of the Earth if they get the chance.
I appreciate very much the clear portrayal of the total ice mass on Greenland and Antartica versus the very small amount of melting that is occurring. But scientific articles will come out continuously about the melting of these ice masses. I guess it keeps these scientists employed, even if it provides nothing useful.
Is the ice mass loss calculations equal to calculated melt or is it a net loss which includes loss through melt and gains through new ice from annual snow accumulation? Net loss could be considerably less than loss by annual melt.