We have previously referred to the Energy Institute’s annual Statistical Review of World Energy. But it’s a bit of a doorstopper, so if you want to cut to the chase and see where the world’s electricity comes from, we recommend OurWorldinData’s Global Electricity Mix page. And there is one particular chart on their page that provides a very helpful summary of the amazing energy transition underway in which renewables are taking over from fossil fuels... or not.
Here’s that chart, showing world electricity production shares from fossil fuels, nuclear and renewables:
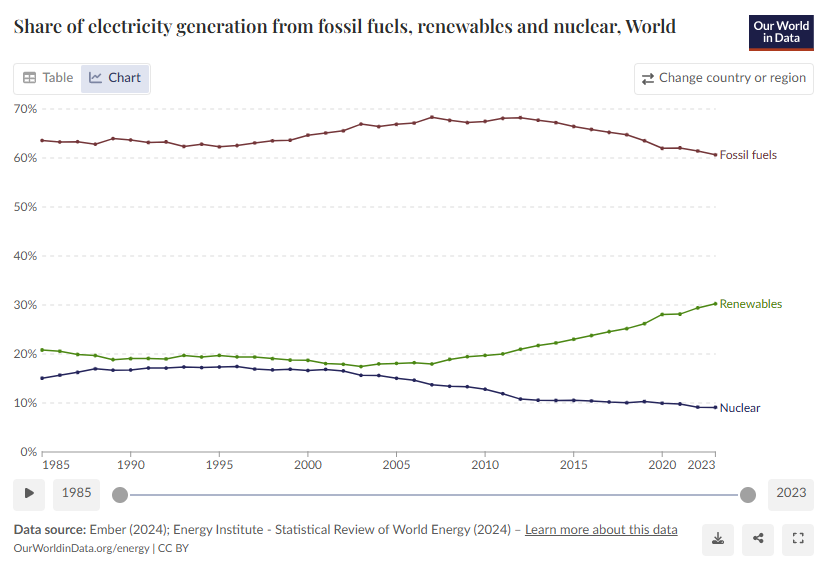
For the first part of the “energy transition”, from 1985 to 2010, the fossil fuel share plummeted rose from 64% to 67% while renewables and nuclear both gave up a bit. After 2010 the renewables share rose from 20% to 30% but not all of it came from fossil fuels, though they did drop from 67% to 61%, because nuclear also dropped, from 13% to 9%. So for the whole interval from 1985 to the present, the fossil fuel share dropped from 64% to 61%, renewables rose from 21% to 30% and nuclear fell from 15% to 9%.
Thus renewables didn’t displace fossil fuels alone, they displaced both fossil and nuclear. And twice as much nuclear as fossil, which is counterproductive if the point is to reduce carbon dioxide emissions, though very much in keeping with progressives’ weirdly irrational fear of atomic energy.
Looking at the last 15 years the share of renewables in global electricity production has gone up, albeit at a punishing price that led to electricity costs soaring in Canada, Europe and elsewhere, to the extent that further growth is likely to be a challenge. It’s one reason public opinion on nuclear is changing and many governments are giving it another look, so its share may rise in the years ahead, possibly even transition. But we don’t expect to see any kind of “transition” in which renewables take over from fossil by 2035 or 2050, no matter how much our governments try to force it or how much pain, in the form of price hikes and blackouts, they expect us to endure in the process of not getting there.


This article summarises very well the state of global energy mix; it reveals the gap between aspiration and reality. I have always seen through the ideological drive to replacing conventional fuels with half-baked renewables. Manageable renewable penetration in the energy mix is in my estimation is approaching its realistic saturation point for the reasons that high levels becomes less dispatchable and requires a logarithmic level of energy quality conditioning, which comes at dramatically higher costs; in addition, grid architecture would require a very radical redesign, at an astronomical investment level.
And keep in mind that renewables here includes hydro as well as burning biomass (for which ancient forests are cut down). Just taking the baseline of 20% for these as a constant, the 'new' renewables are only about 10% of the energy mix, 6% of which displaced nuclear, arguably causing more damage to weather- and eco-systems.
So effectively 4% in the last 20 years... That gets us to net 0 in about 300 years. I'm really curious how they plan to get there by 2050 instead of 2325. They must have a really good plan lying around somewhere...
Job, it’s not lying around, it’s just lying.
Not to rain on anyones parade, but you also need to look at the total electrical generation, which did not remain the same. So even with growth of electricity from renewables, it doesn’t mean we’re on a path to net zero, just that electricity from fossil fuels grew at a slower rate than renewables, and it also doesn’t reflect that renewables are subsidized by governments and that without the subsidies renewables likely would have remained about the same percentage. Oh, and electrical generation is only part of the total energy consumed, and for instance the energy for transportation from renewables isn’t going to go anywhere anytime soon—even electric vehicles are fueled mostly by fossil fuels.
The UK's Drax power station, the largest in the UK providing about 5% of the total UK supply, was converted a few years ago from coal to wood pellets,so that it is now classified as a renewable energy plant. Wood combustion produces more emission than coal, but what the heck, it's the thought that counts.
Let's not forget for a moment that while governments have been subsidizing renewables with TRILLIONS of tax dollars in the last couple of decades,they have been punishing fossil fuel users with carbon pricing galore.That's the main reason why renewables show an uptick in this graph,while fossil fuel show a decline.And the carbon taxes are usually hidden in the cost of goods and services we purchase.But in the case of my nat. gas bill it is visible,it was about 25% of the total bill!Until Carney "suspended" the consumer carbon tax.But it's not gone,not by any stretch.