Dr. Roy Spencer just announced the publication of his new peer-reviewed paper on Urban Heat Island effects on U.S. summertime temperature data. The headline number is that, as Spencer says, “65% of the U.S. linear warming trend between 1895 and 2023 was due to increasing population density at the suburban and urban stations.” But don’t run to the presses with that conclusion just yet, because there are some caveats. First, at the rural stations the contribution of population density was only 8%. Second, most of the UHI effect Spencer uncovered happened prior to 1970. Third, the paper only looks at summertime data, and uses what is called the “Raw” temperature record. One of the reviewers of the paper insisted that the “Cooked” data (they prefer to call it “Homogenized”) has been adjusted to remove all the effects of urbanization so there was no reason for Spencer to examine it. That claim, if correct, would neutralize the impact of his paper, because defenders of the status quo can say they already knew about the problem and fixed it. Unfortunately, the journal wouldn’t let them run the test. And, as Spencer notes, other researchers have looked at the way they fix the data and have said that rather than cleaning up the dirty data, they actually end up dirtying the clean data.
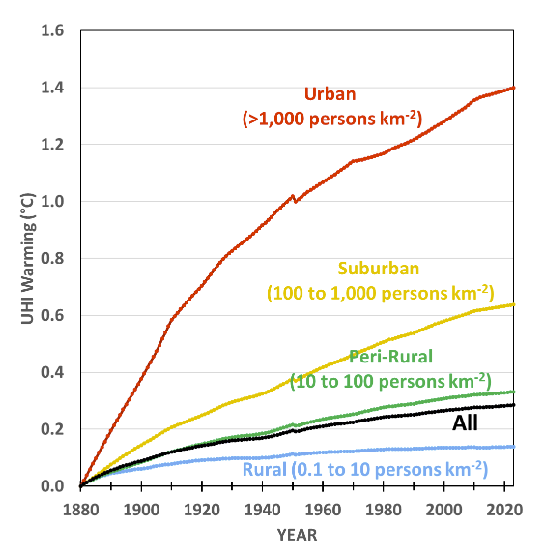
Spencer and his coauthors made use of global population records back to 1850 that provide estimates of the number of people per location around the world. They used that to estimate changes in population density at each location and compared that to changes in temperature at each location. By comparing nearby places where the population density changed faster in one place than another they were able to develop a statistical formula attributing warming to urbanization, even in sparsely populated areas. Their analysis started with US data in the summer months (they will get to global data later). The results from 1880 to 2022 show strong UHI warming in urban areas, less in suburban and minimal in rural areas. The national average is closer to rural areas because they occupy so much space, although the urban result corresponds to what most people experience:
Spencer reports that:
“One of the reviewers, who seemed to know a lot about the homogenization technique used by NOAA, said the homogenized data could not be used for our study because the UHI-trends are mostly removed from those data. (Homogenization looks at year-to-year [time domain] temperature changes at neighboring stations, not the spatial temperature differences [space domain] like we do). So, we were forced to use the raw (not homogenized) U.S. summertime GHCN daily average ([Tmax+Tmin]/2) data for the study.”
GHCN refers to the Global Historical Climatology Network, which is the archive where all the surface temperature records are stored. In effect the reviewer said don’t worry, we have algorithms that fix the problem. Nothing to see here, move along.
But, Spencer notes, the way the NOAA people supposedly fix the problem is that they average urban and rural areas together. Supposedly because it relies on the eccentric theory that doing so will remove the contamination from the urban record instead of adding it to the rural one. Which a 2023 paper by Japanese and Irish researchers argued is indeed what is more likely happening.
Surely a more rational process would be to compare changes in various rural stations to those in nearby urban ones, and if the latter are warming more, adjust them downward. If, that is, you really wanted to get an accurate result.
As Guelph economist Ross McKitrick has documented over the years, the IPCC insists there is no urbanization contamination of the land surface temperature record. Yet they not only have no evidence to back up their claim, they have a bad habit of inventing non-existent evidence and preventing publication of anyone’s attempt to get evidence. As Spencer’s experience shows, both the data contamination and the peer review bias problems persist.


This was a good analysis of a baloney study.
Globally 71% of the world is oceans
= no UHI there
about 50% of the land (29%) is uninhabited.
= no UHI there
That adds up to 85.5% of Earth's surface with no UHI possible
Urban ares are only 0.9% of Earth's surface, although UHI can be anywhere with economic growth.
It's not rocket science to determine that the more densely populated a location becomes,the warmer it becomes generally.The UHI effect.What,with the increased amount of heat-absorbing ashphalt,cement,brick infrastructure.Heat-generating cars,people,buildings,power stations,furnaces,air conditioners,etc.It's almost a no-brainer.And nothing to do with climate change.