From CO2Science: Introducing their study the authors Dubos et al. write that body size is “a key determinant of individual fitness and population dynamics, affecting reproductive performance and survival.” Yet they say that when it comes to birds – our fine feathered friends – “little is known about the mechanisms underlying changes in body size induced by environmental changes in temperate climates.” And so it was that this team of eight French researchers set out to explore the influence of temperature and food availability on the body size of 41 songbird species common to France.
Paper Reviewed: Dubos, N., Le Viol, I., Robert, A., Teplitsky, C., Ghislain, M., Dehorter, O., Julliard, R. and Henry, P.Y. 2018. Disentangling the effects of spring anomalies in climate and net primary production on body size of temperate songbirds. Ecography 41: 1319-1330.
More specifically, Dubos et al. examined the interannual variability in wing length and wing length-adjusted body mass of both juvenile and adult birds in relation to climate (temperature and precipitation) and primary production over the period 2000 through 2014. Wing length served as a proxy for body size and length-adjusted body mass as a proxy for body condition. Monthly satellite records (NDVI, normalized difference vegetation index) served as a surrogate of primary production, which provides a representation of food availability.
Statistical analyses revealed no effect of climate or food availability on adult body size (wing length) or adult or juvenile body condition (length-adjusted body mass). Juvenile body size, in contrast, was related to primary production such that they were larger in years with positive NDVI anomalies via the quadratic relationship shown in Figure 1a, where “the squared-effect of NDVI explained 13% of the temporal variance in wing length common to all species.” In addition, Dubos et al. report juvenile body size was also related to temperature (Figure 1b) such that wing length increased by 0.09 ± 0.03 mm for every 1°C rise in temperature. However, this effect of temperature was described as “weak and relatively less important than net primary productivity in determining juvenile size.”
Commenting on the above findings the authors note that body size is “largely heritable” and that “most of the interannual variation should be captured by heritability,” which helps to explain why only a small part of body size variance was captured by NDVI or temperature. Nevertheless, the portion explained by NDVI and temperature bodes well for the future. With respect to the positive relationship between temperature and juvenile body size, Dubos et al. point out the fact that in temperate (i.e., cooler) climates, rising temperature “reduces the cost of juvenile heat maintenance,” which “results in higher metabolic allocation for growth, which could explain the positive effect of high temperatures on juvenile size.” And with respect to the relationship between NDVI and juvenile body size, they write that “as climate warming is expected to increase the frequency of positive anomalies in primary production, we predict that climate change will induce a body size increase in temperate songbirds.”
However, the predicted increase in NDVI can (and does) occur without climate warming, courtesy of rising atmospheric CO2 concentrations that are enhancing vegetative productivity (i.e., the food supply for birds) all across the globe (see many examples of this phenomenon in our Subject Index under the heading Biospheric Productivity). Consequently, we have a situation where future changes in climate and atmospheric CO2 concentrations will likely exert a positive influence on the body size of the 41 birds examined in this study.
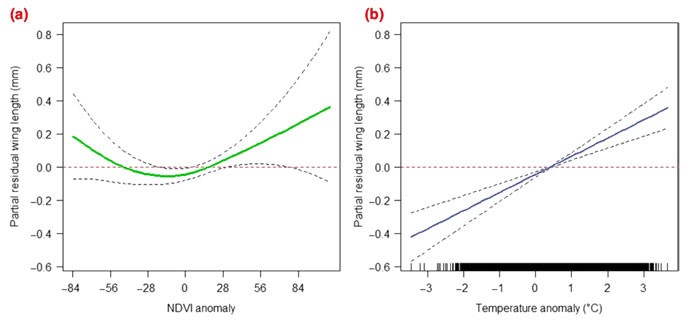
Figure 1. Relationship between partial residual wing length and local anomalies of (a) normalized difference vegetation index (NDVI) and (b) temperature for 41 temperate songbird species. Solid lines represent regression spline fits from generalized additive mixed models. Dashed lines represent 95% confidence intervals. Source: Dubos et al. (2018).


