From CO2Science: According to Yan et al. (2017), sea ice cover “has long been recognized as a sensitive and important indicator of the climate system in both global and regional observation and modelling studies.” From an observational standpoint, however, most studies on sea ice extent have been conducted on high latitude frozen seas. Long-term changes in the variability of sea ice cover from the middle latitudes, in contrast, are generally lacking. In an effort to fill this data void, Yan et al. examined continuous satellite imagery over the period 1988-2015 to ascertain changes in ice cover for the Bohai Sea, a semi-enclosed sea located in North China.
Paper Reviewed: Yan, Y., Shao, D., Gu, W., Liu, C., Li, Q., Chao, J., Tao, J. and Xu, Y. 2017. Multidecadal anomalies of Bohai Sea ice cover and potential climate driving factors during 1988-2015. Environmental Research Letters 12: 094014.
Covering an area of nearly 75,000 km2, the Bohai Sea extends from approximately 37-41° N latitude and 118-122° E longitude and is the southernmost frozen sea in the Northern Hemisphere. After excluding images covered with clouds or that were of inferior quality, a total of 640 remote-sensing images were utilized to determine winter sea ice cover trends.
As indicated by the figure below, Yan et al. report that “despite the backdrop of continuous global warming, the ice extent in the Bohai Sea exhibited a small overall increasing trend of 1.38% ± 1.00%/yr during the study period.” Additionally, they report that the detrended annual average ice area was correlated with a decrease in the mean ice-period average temperature obtained from 11 meteorological stations around the Bohai Sea, as well as with a mild increase in cumulative freezing degree days.
In light of the above findings, it appears that sea ice cover in the Bohai Sea is not quite as sensitive to CO2-induced global warming as climate model projections/theory suggest it should be. Rather, in apparent defiance, it has behaved in an opposite manner!
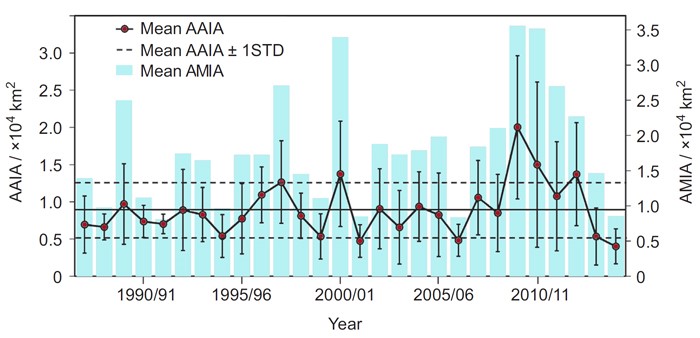
Figure 1. Annual average ice area (AAIA) and the annual maximum ice area (AMIA) in the Bohai Sea over the period 1988-2015. Adapted from Yan et al. (2017).


