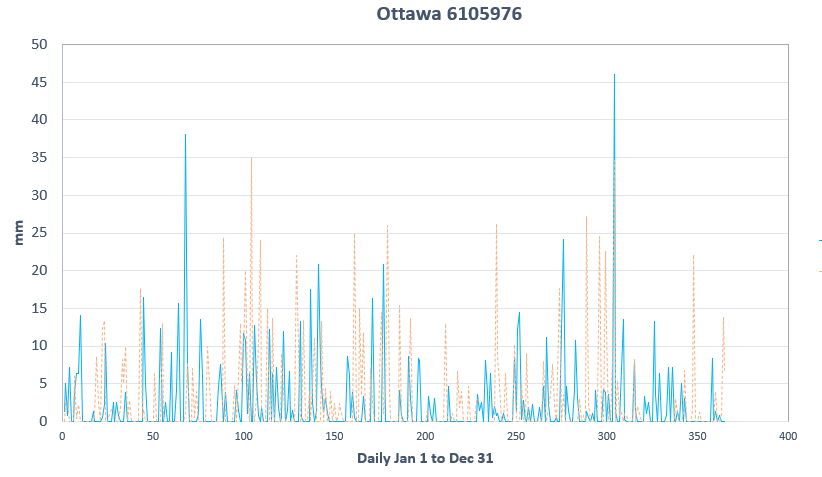
We end up where we began our quiz series, in Ottawa, looking this time at precipitation in Canada’s capital, where countless politicians, journalists and activists talk as if it’s a foregone conclusion that the weather now is completely unlike the weather that befell the city back when Sir Robert Borden was Prime Minister. You be the judge. One of the lines in this chart shows total precipitation in 1919 and one in 2019, but we haven’t labeled which is which. Can you guess?

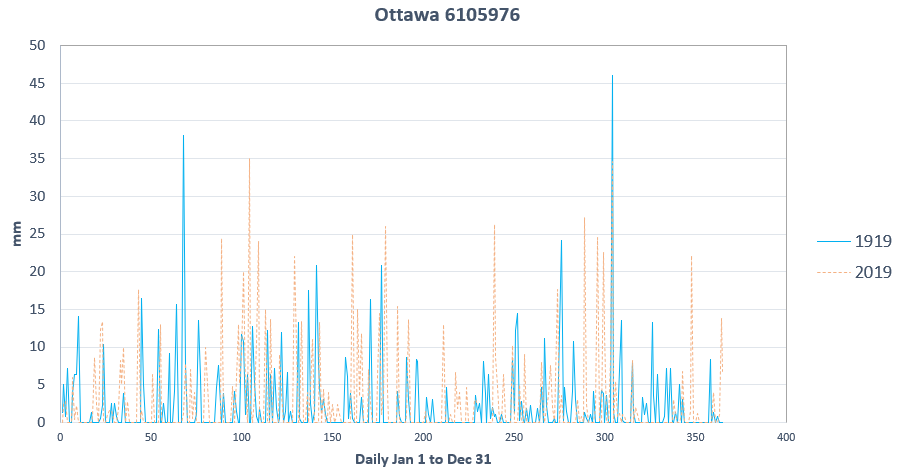
Here’s the answer:

One curiosity about these two years in Ottawa a century apart is that the annual peak was on exactly the same day (October 31st, day 304), with 1919 getting 46 mm and 2019 getting 35, which was a tie with April 4 that year.
Another curiosity is that so many places across Canada rushed to declare a Climate Emergency in 2019 without bothering to check if the weather was different in any important respect from what it had been 100 years earlier.
See Comments 
1919 or 2019? Back to Ottawa
15 Jul 2020 | 1919 or 2019, Science Notes


thanks for pointing that out (the peak), it wasn't obvious at first glance