Our tour of Canadian cities suffering the horrors of the climate emergency takes us today to Montreal PQ, where records go back to 1871. And it's good they go back that far because that year the average temperature (measured as the Min-Max mid-point) hit 10.3 degrees C and precipitation was a meagre 489.5 mm, records not set since.
Montreal’s temperature history looks like this (to generate this graph use the Annual Data version, not the July-June version):
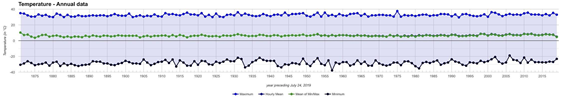
If you want an upward trend you’ll have to tilt your screen: it's a remarkably stable picture. The coldest average high was 1992 while the warmest was 1975. The coldest low was 1957 and the warmest was 2006.
The number of days each year over 30 degrees C looks like this:
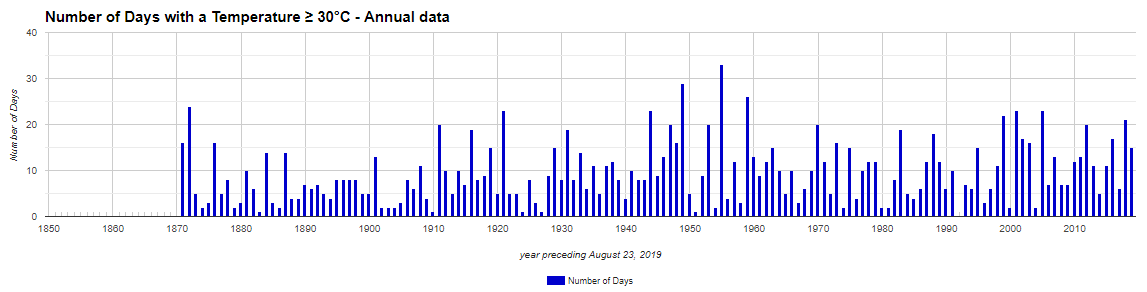
Apparently 1955 was a sizzler, with 33.
Precipitation looks like this:
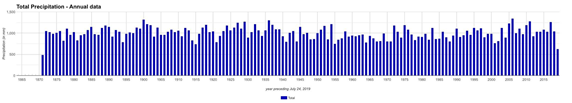
The minimum was in 1871 and the maximum was 2006 (which barely edged out 1900).
Windspeed looks like this (maximum 1959):
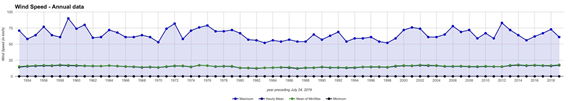
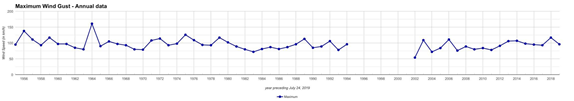
and wind gusts look like this (maximum 1964):
As emergencies go, this one gets more disappointing with every stop.


