Regular readers of CDN will not be surprised to hear that: “Europe is warming >2x as fast as the global average, reducing snow & ice cover.” This stunning finding, complete with bright red map of the blazing region in question, comes via the World Meteorological Organization from a European outfit, the “European Centre for Medium-Range Weather Forecasts (ECMWF), which implements the Copernicus Climate Change Service”. Implements? Um yeah but never mind. The key point is that, as everybody knows or should, and their own chart actually pretty much reveals while painting everything scary red, everywhere anyone lives is warming “faster than the average” because the land is warming faster than the oceans. And since the WMO and the ECMWF and the CCCS all know it, it is irresponsible if not dishonest to keep recycling this rhetorical trick.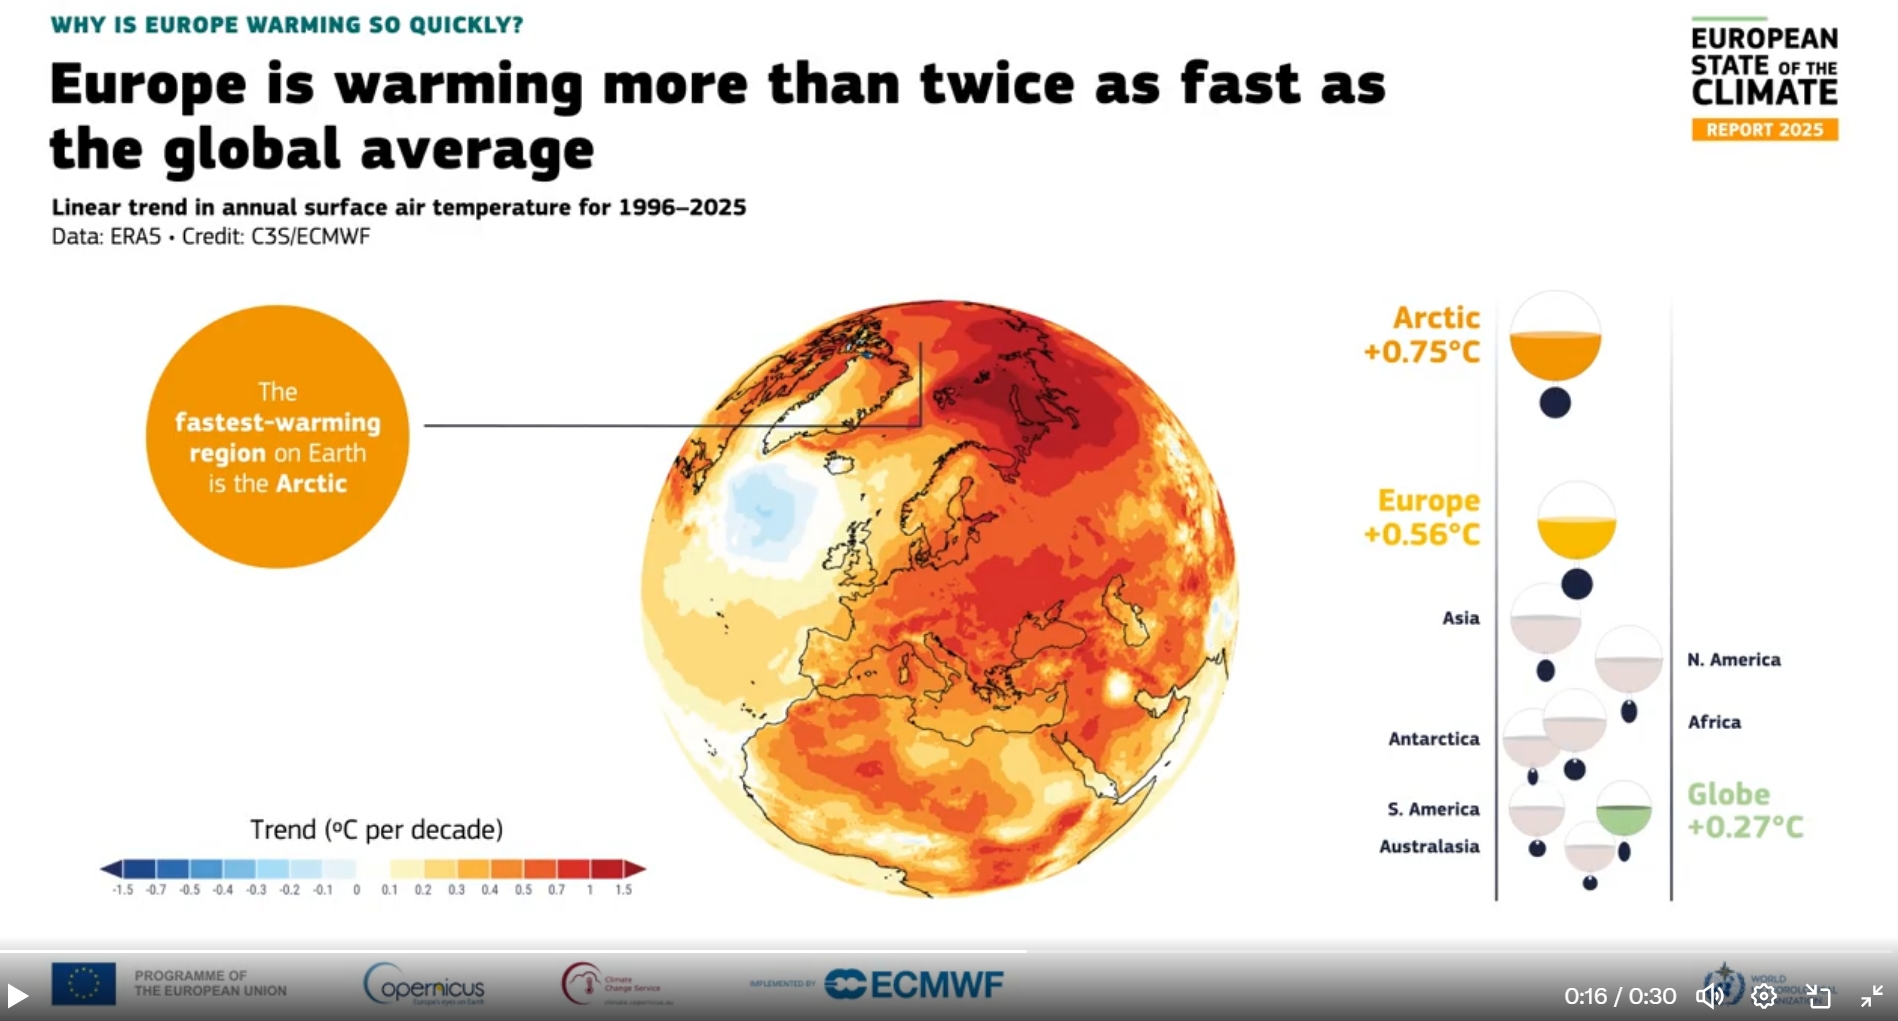
We note that in their chart-like object, there actually is one place that is not warming faster than the alleged average, namely “Australasia”. Yet the climate zealots who live there tell another story; their government publication “Climate Change in Australia” insists that “Up to the start of the recent decade (2011-2020), Australia warmed by an estimated 1.6 °C since 1850-1900, which is around 1.4 times the global average and 0.9 times the global land average.” Which does at least admit that the seas are warming more slowly than the land, while insisting that we’re on fire yay us in direct contradiction to the European agency’s stats that no we’re on fire you’re just steaming yay us.
This absurd spat about who’s most on fire should alert you to weaknesses in the data put forward so apodictically. But so should another even more suspicious feature of the Copernicus/WMO/Whoever graphic, because even if you flunked high school statistics, it must be clear to you that having one small region marginally below the global average cannot possibly offset the much larger extent to which such land masses as Asia, North America and Africa are allegedly above it. You wonder what these people even think average means.
And what they think change means. We draw your attention to how the study shows other graphics, meant to scare you out of your parka, illustrating “The area of Europe experiencing days below freezing is shrinking”. But only trivially. Since we know that the planet has been rebounding from the Little Ice Age since at least 1800, with glaciers retreating, for purely natural reasons, it would take a bold or even reckless band of state-funded activist scientists to claim that a mild diminution of frost in Spain over 60 years proves much of anything.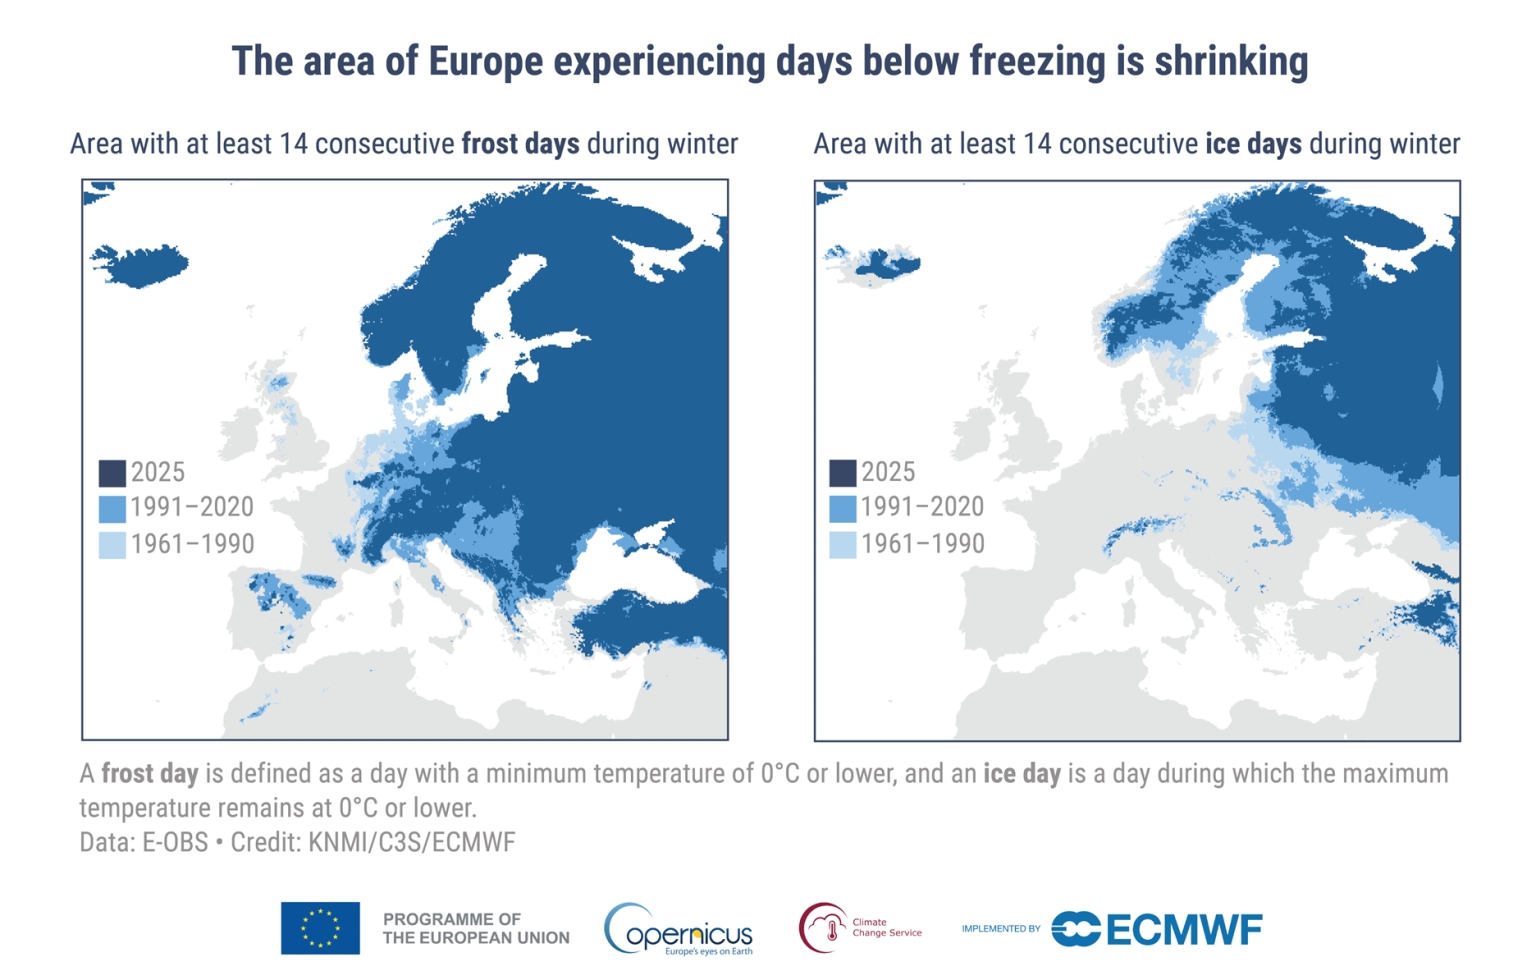
Since climate is by definition the average weather conditions somewhere over at least 30 years, it is not illegitimate to compare 1961-90 with 1991-2020. But if you do, of course, what you see is extremely minor changes of exactly the sort such a natural rebound would lead you to expect. And since we know, unless we are Michael Mann, that the Little Ice Age was the coldest the planet, including its European bit, have seen since the last glaciation, there is nothing, nothing in those graphics to suggest that Scotland, or the Netherlands, are seeing fewer “frost days” or “ice days” now than they were during the Medieval Warm Period. Which means there is nothing to suggest that what we’re seeing is man-made/unnatural, or in any way worrisome.
As for 2025, part of an odd heat spike the models cannot explain that seems to be fading away, even it seems to represent a strikingly small departure from conditions in 1961-90. Which is not much to show for being on fire. But not to worry. They cram in everything from river flows to storms to renewables to how “Biodiversity is vital for a sustainable future, but climate change is a major cause of its degradation” even though climate change is a statistical description not a causal force. And of course record wildfires so they insist that they are on fire, literally. Yay them.


global warming in the past 50 years has nothing to do with the little ice age and a lot to do with CO2 emissions. a reduction of air pollution. and the reduction in the percentage of cloudiness. the first two causes are man-made and the change in cleanliness could be a man made feedback, or a natural forcing (we don't know)