In chapter 2 of this summer’s “Red Team” report on climate for the United States Department of Energy, the research team looked at the direct impact of CO2 on the environment, namely global greening and effects on ocean alkalinity. In chapter 3 they move on to indirect effects, namely climate impacts. They start by noting that the climate has changed all through Earth’s history, driven by factors such as oceanic cycles, orbital changes, solar variations, volcanoes and more. Humans are also changing the composition of the atmosphere by emitting CO2 and aerosols. This changes the balance of energy coming in from the sun and going out through radiation at the top of the atmosphere. This balance is, according to the IPCC, called “radiative forcing”, and the DOE report presents the numbers as they are shown in the IPCC reports. But they also point out something often left out: changes in radiative forcing due to greenhouse gases, as measured by the IPCC, are very small, indeed are below the measurement limits of modern satellites. So we’ve been given error bars as proof positive, which is not how science works.
On page 12 of their report, the DOE team reproduce the IPCC’s estimates of how much each type of radiative forcing has changed since 1750. The IPCC says the sun has added very little to forcing, and therefore warming, although the DOE team point out that this is because they pick the solar reconstructions that imply very little solar brightening since the 1700s. There are other reconstructions out there that claim the sun has brightened somewhat. They also refer to the ACRIM gap controversy, a topic we covered in our video on the topic, which involves how to calibrate readings to cover a gap in the satellite record of solar energy measures due to the Space Shuttle Challenger explosion in 1986, adding to the debate about whether the sun has contributed to warming in recent decades. The DOE report doesn’t express a view on the topic, it just mentions it.
The IPCC tally of radiative forcing includes the positive (warming) effect of CO2 and other greenhouse gases and the supposed cooling effect of aerosols (i.e. particulate pollution). It all adds up to about a 3 Watts per square meter increase since 1750. Which sounds like a lot, and looks like a lot in the way it is usually graphed. So they add some helpful context:
“However, this is still only about 1 percent of the unperturbed radiation flows, making it a challenge to isolate the effects of anthropogenic forcing; state-of-the-art satellite estimates of global radiative energy flows are only accurate to a few W/m2.”
This figure, of about one percent of the total energy flow in and out of the climate system in Watts per square meter due to solar heating and planetary cooling, is simply too small to be confident about our measurements even with modern satellites. Funny we haven’t been told of it before.
It’s especially important context because the report next discusses the change in atmospheric CO2 since 1958. Those charts can look scary the way the axis is always compressed, but the DOE team drew it differently, starting at zero:
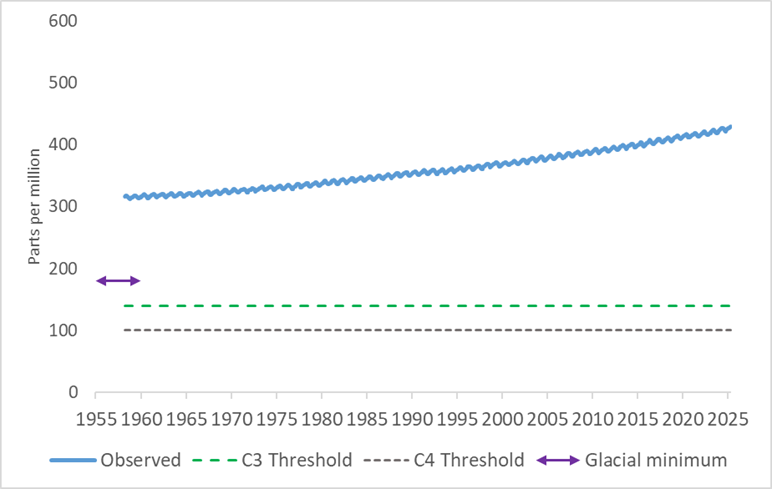
The blue squiggly line is the CO2 level, and it’s squiggly because atmospheric CO2 has an annual cycle, dipping in the northern hemisphere spring and summer as plants sprout and absorb more, and rebounding in fall and winter as they die and decay. The green and grey dotted lines are the levels below which plants start dying not as part of a cycle where they sprout again in spring but as part of extinction (plants are grouped by biologists into C3 and C4 categories with the latter, more recent evolutionarily, better suited to the ominous CO2 famine that has gripped the Earth for tens of millions of years). The purple arrow shows how far CO2 fell in the depths of the last glaciation around 20,000 years ago, when it got perilously close to a level where plants start dying off en masse and permanently.
The rate at which the blue line will continue rising will depend on future CO2 emissions, which brings up the business of IPCC scenarios. We’ll look at their treatment of that issue next week.


It seems obvious to a degree ,that anyone above moron level must understand, that increased Solar Activity will Warm the Planet yet everyone,including CDN makes little of the fact that we have 1200 years of observations which show that we are unquestionably in a Solar Maximum. Just Google that and it slaps you in the face.
While the absolute value of Earth's total energy imbalance is challenging to measure directly with satellites alone, the change in forcing over time, particularly the component from GHGs, has been directly observed and quantified.
Measurements & claims for between 1750 and 1975 are irrelevant and inaccurate.
The "age of man made CO2" was after 1975.
Spectroscopy tells us that adding CO2 to the atmosphere will cause global warming. Global warming will cause an increase of absolute humidity, which will amplify the warming. Absolute humidity has increased since 1980, but the measurements are not very reliable. CO2 emissions and the reduction of atmospheric air pollution, combined, explain the warming since 1975. They explain the amount of warming and the pattern of the warming. Changes in solar energy measured at the top of the atmosphere explain none of the warming. Measurements of changes in cloudiness are not very reliable. The reduction of cloudiness in the past few decades should cause warming in the day and cooling at nights. In reality, nights have been warming faster than days. The climate effect of changes in clouds is still a mystery. Not even known if clouds are a climate forcing or climate feedback. It is a fact that it's impossible to measure the percentage of man made versus natural warming since 1975. Evidence that the warming had man made causes is much stronger than evidence that it was natural. There are too many conservatives who claim that the lack of precise measurements prove that CO2 does little or nothing . They are science deniers.
This DOE series of articles is DOE cheerleading, not DOE fact checking.
There is no solar maximum. That is a conservative fantasy.
Solar energy TSI measured at the top of the atmosphere has barely changed since the late 1970s. TSI has actually declined slightly. That means the energy coming from the sun is almost constant and has caused none of the warming since 1975. The NASA satellites measuring solar energy at the top of the atmosphere since the late 1970s tells us that sunspot counts are a nearly worthless proxy. Sunspot counts grossly exaggerate tiny changes in solar energy. Any climate conclusion based on sunsets counts, rather than accurate satellite measurements, is worthless. The claim of a solar maximum is based on sunsets counts, falsified by top of the atmosphere satellite measurements.
Richard maybe you should stop tossing in the little insults about conservatives in your comments. They undermine any claims you make because they are irritating and distracting but also irrelevant.