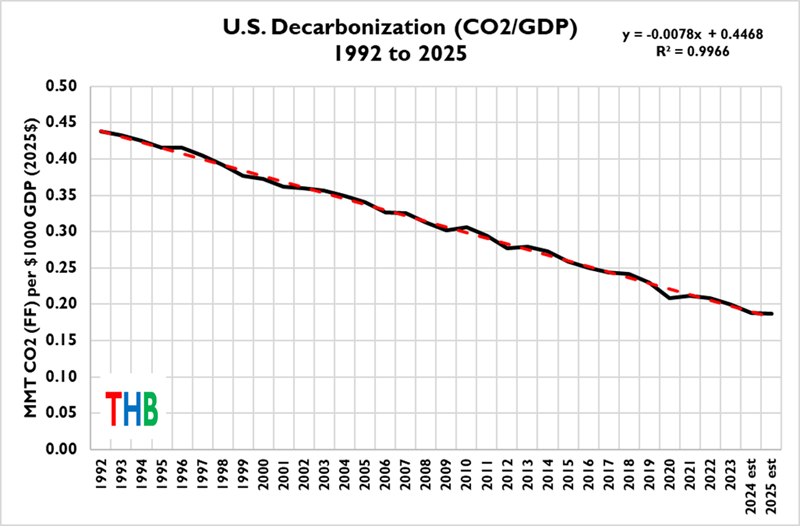
We frequently mock the idea that the world is in an energy transition and that big, industrialized countries are in the process of decarbonizing. But when confronted with convincing data we must sometimes change our minds. And Roger Pielke Jr. has recently shown a chart on his Substack of US emissions intensity, aka million tonnes of carbon dioxide emitted per thousand dollars of Gross Domestic Product (GDP), adjusted for inflation, showing that over the 34 years since 1992, the year of the Rio conference that got the ball rolling on climate policy, emissions intensity fell by a little over half. But there are two other remarkable features of the graph. First, it is a straight line sloping downward. For most of that time there was no federal climate policy in the U.S. but it made no difference whether there was or not. Second, it is still going down and at the current pace could reach zero in 2050. It probably won’t but, again, whether it does or doesn’t won’t have much to do with climate policy.
Here is the chart:
In 1992 few had heard of climate change or as it was then known “global warming”, and there were no government policies in place to cut carbon emissions. Five years later, in 1997 many countries signed the Kyoto Protocol but the US said a very loud No Thank You.
More than a decade after that dramatic lack of policy change, in 2009, the US Supreme Court ruled that the Environmental Protection Agency did have the authority to regulate greenhouse gases. That ruling under Barack Obama led to the 2015 Clean Power Plan and new motor vehicle tailpipe emission standards. And that same year the US agreed to the Paris Treaty Accord Agreement, only to exit in 2017 under the Trump Administration.
Now look back at the chart. See anything to correspond to that flip then flop? Well then, how about 2022, when the Biden Administration went all-in on climate and passed the Inflation Reduction Act, enacting the Green New Deal and throwing countless hundreds of billions at green energy and other emission-reducing boondoggles. And remember that along the way there have been state and federal programs to subsidize ethanol, litter the countryside with windmills and solar panels, bribe the public to buy EVs, and all the other things politicians do to save the planet.
Try to spot the date of any of them on the chart. Nope. The line followed its own pace down oblivious to policies or lack thereof. In his essay, Pielke Jr. points out that the big driver of the reduction has been the gradual changeover from coal to natural gas in power generation. That was partly due to air pollution (not greenhouse gas) rules, and partly due to good old market incentives, specifically the fracking revolution that made gas much cheaper than coal. Another driver of the change is that the industrial side of the economy has grown slowly compared to the services sector which uses a lot less energy. So even if the power grid were as carbon-intensive as before, GDP would be less energy-intensive and less emissions-intensive. So governments yapped and firms acted.
As a result, the emissions intensity numbers fell from about 0.4 megatonnes per thousand dollars of GDP in 1997 to 0.2 in 2023. So if it kept going at that pace, 26 years to fall by 0.2, it would hit zero in 2049. But will it keep going at the same rate? No. To paraphrase Stein’s Law, trends that can’t continue won’t, and one reason here is that eventually all the coal-to-gas conversion that can be done will have been done. In fact, with all the new AI data centers being built more coal may start reappearing.
It’s just unrealistic to think that the US economy will ever be decarbonized. Somebody somewhere will be using some kind of hydrocarbons to power something. Still, if the recent past is any guide the line will keep going down for another decade. Which, like whatever happens afterward, will have very little to do with climate policy decisions.


Prior to the global warming nonsense and the ozone layer BS, industries competed by building more efficient machines, as an example a 400 amp welding power supply used to consume a lot of power when sitting idle but no longer, modern power supplies consume very little power (enough to turn on a little fan every now and again), in addition, when in use they improved from 40% efficient to over 90% efficient since the new machines were solid state leading to minimal losses to heat, the machines also worked much better! In the chemical realm, for many decades perchlorethane otherwise known as perc or dry cleaning fluid was a very effective grease solvent, but it was deadly to humans, perc was replaced by trichloroethane, which was equally effective but harmless to humans (in small quantities), these chemicals were used to degrease metals and electronics. The end users of trichloroethane became very effective at recycling it as it was expensive. In both cases free market competition forced companies to improve the efficiency and effectiveness of their products. As the chart shows, environmental regulation had no effect on the rate of decline in pollutants, otherwise known as expensive industrial inputs!
I hear you Thomas.When I bought my first brand new car in 1998,the brochure explained that it was 98% less polluting than 1970 models which were all burning leaded gasoline,and not very fuel efficient either.My eight-year-old Chevy is the most fuel efficient car I have ever owned.Though I believe the oil industry was forced to get the lead out of gasoline by way of regulation,not sure they did so voluntarily.
Graph needs to be corrected for GDP per capita or GDP corrected for inflation….to be very meaningful…