As we often say, with climate change you can say anything. Warm winter? That’s due to climate change, see. Greenhouse gases make the air warmer and then there’s less snow and yada yada yada. Cold winter? That one’s climate change too. Arctic warming causes the jet stream to become wavier so Arctic air flows further south in the winter and we end up with brutally cold weather which is another sign of global warming. Heads I win, tails you lose. And if you’re thinking it’s all too convenient and contrived you’re right. For one thing, as Tony Heller has pointed out, back during the 1970s scientists blamed a wavy polar vortex on global cooling, so it’s a bit awkward now to turn around and blame the same thing on global warming. Second, as explained in a new study, reconstructions of jet stream waviness back to 1901 show that it was even wavier than today in the past and today's variations are nothing new. Drat.
The authors admit that we don’t have direct satellite observations of the jet stream prior to the 1970s. But we do have observations of surface and atmospheric weather patterns which can be fed into weather models to reconstruct what the jet stream was likely doing at the time to generate the observed weather variations. They also acknowledge that the jet stream became wavier over the 1990 to 2010 period. But that development doesn’t match the pattern of cooling events. Specifically, there was an anomalous cooling trend over the US Southeast from the late 1950s to the late 1980s which people have attributed to the wavy polar vortex but that timing doesn’t make sense. If the jet stream has just recently become wavier, since 1990, it can’t have driven cooling or anything else from the 1950s to the 1980s. So, they figure, the story isn’t as simple as people are making out.
To get more insight they reconstruct two indexes of jet stream waviness, called the Meridional Circulation Index or MCI and the Local Wave Activity index or LWA, the differences being based on the type of wind flow data used. The graph of the MCI looks as follows:
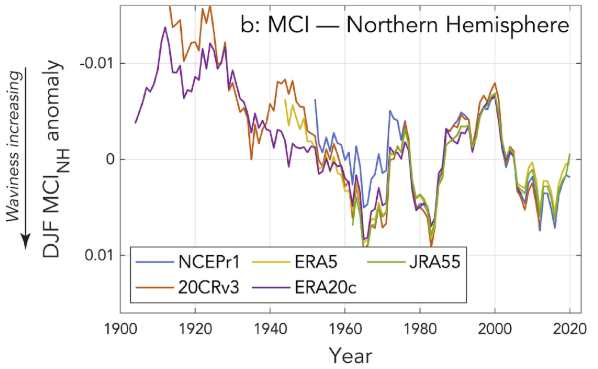
The colored lines correspond to versions of the reconstruction based on the indicated weather data series (NCEPr1, ERA5 etc). The LWA series looks the same except the first part doesn’t slope down as steeply.
Increased waviness of the jet stream corresponds to a decreasing trend in the graph. (Isn’t science fun?) From 2000 to about 2010 the line falls, corresponding to increasing waviness. That was what got everyone thinking it must be global warming. But, the authors point out, there were many earlier episodes when the MCI fell as much or more as in the 2000-2010 interval, and reached lower levels than anything seen this century. They conclude their various jet stream reconstructions by saying that they:
“all indicate that these recent increases in Northern Hemisphere mid-latitude jet stream waviness are well within 20th century variability, and periods of higher waviness occurred in the 1960s–1980s, prior to the emergence of Arctic amplification. This analysis highlights the importance of using long-term records to guide and contextualize analysis of modern environmental change.”
Long-term records and proper context: what a concept. Next time someone points to a short-term change and claims it proves you're to blame, ask them to explain the range of long-term natural variations. If they can’t, or claim there are none, remember what we learned about the jet stream and wave them away. It’s cool. Or something.


