Look it up, way up, because clouds are where the action is. In a climate model, CO2 doesn’t do most of the warming. Instead that honour goes to water vapour, which occurs everywhere in the atmosphere at varying concentrations. When the vapour condenses into large collections of droplets we call it a cloud. And according to the theory, as the air warms a bit due to water vapour, it can hold more water vapour which, being a far more potent greenhouse gas, then dramatically boosts the initial warming. But what of practice? The observed concentration of water in the air is called the “specific humidity” and the concentration relative to the maximum possible at the current temperature is called the “relative humidity”. As you rise above the surface (though a weather balloon would not be a very comfortable ride) the models say you should observe increasing specific humidity and constant or increasing relative humidity, yielding a stronger and stronger amplifying effect as you go up through the lower and mid-troposphere that then weakens as you approach the top of the troposphere at about 16 km altitude. The models say. But to see what the data say we can turn to Professor Ole Humlum’s Climate4You website. And they tell a very different tale.
The specific humidity since 1948 at three levels (surface, lower troposphere and mid-troposphere) is shown on this chart:
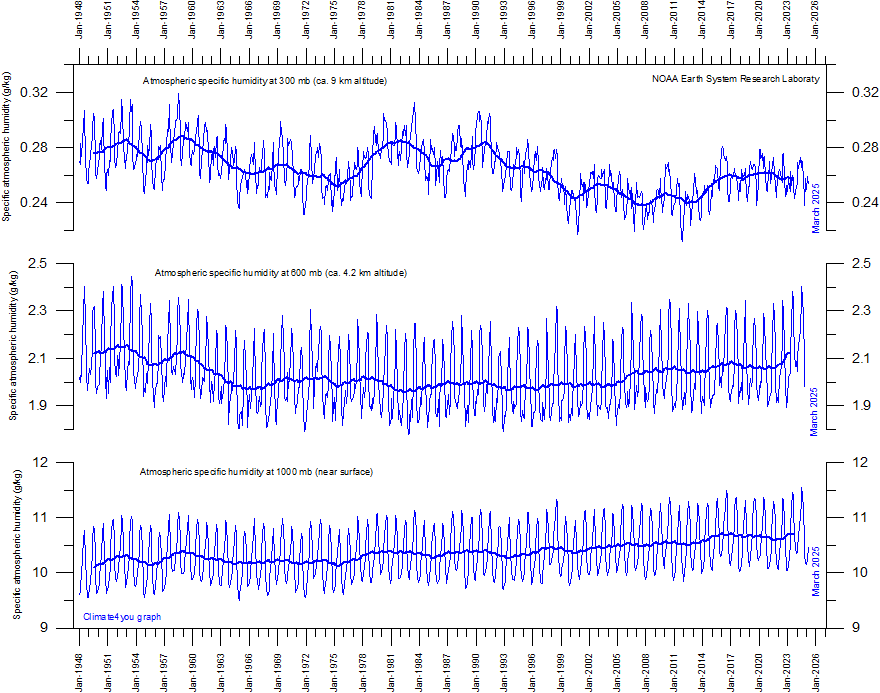
We see a fairly steady upward trend in specific humidity at the surface and in the lower troposphere (600 millibar layer) after 1970. But in the mid-troposphere (300 mb) there is more variability and, since the late 1970s, a downward trend.
As for relative humidity, the models say it should be steady or increasing at each level. But the data show the following:
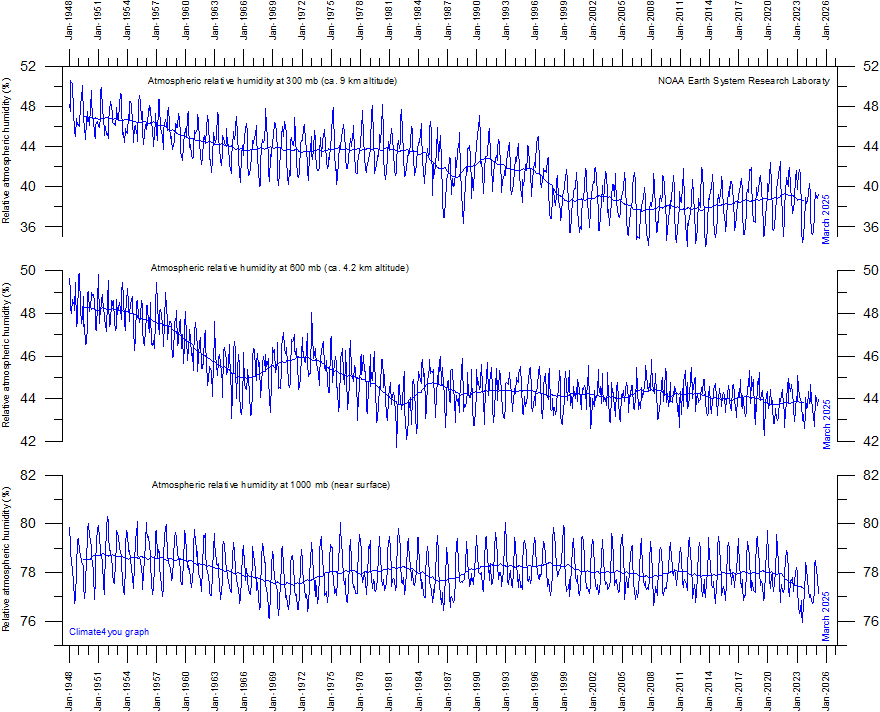
Oh dear. It seems to be steady at the surface but declining above. Admittedly for the past 25 years it’s been steady in the mid-troposphere and only declining a bit in the lower troposphere. But what you see is not the overall picture we would expect from the world of settled science. Instead it’s the kind of complications and anomalies we expect in the world of messy data, as long as we know how to #lookitup.


That data supports the idea of global warming. Total water in the air increasing but relative humidity decreasing. The only way that happens is if you raise the temperature of the air. Watch a hydrometer. In the cool morning relative humidity is high. As the sun warms the earth and air the relative humidity drops. Warmer air can hold more water. Interesting that the total water contained in the upper atmosphere is dropping but the relative humidity is too. That would say the upper atmosphere is stable in temperature and the moisture in the air is dropping. The data is a bit confusing and is not telling a single coherent story. All very interesting.
Earth is mostly a water planet, 70% covered by ocean, add polar ice, add snow, add wet recently rained-on land…..
The vapour pressure of water increases by 7% per degree of temperature increase (at 15 C)…..so the bottom pane of the first graph, “near surface specific humidity” infers about 1/2 C rise in global temps since 1948. This is a reasonably good verification of the global temperature records if one throws out urban heat island effects. Just sayin’….
The higher elevations are also going to be subject to much fewer samples, basically weather balloons only, plus be much more subject to cloud cover variations, thus have much less reliability.
The positive water vapor feedback is determined by global average absolute humidity in the troposphere
Not relative humidity at any specific altitude
such measurements are very rough and can not be used for any conclusions
also the amount of sunlight blocked by clouds is not measured
the proxy of % cloudiness is also not accurate.
% cloudiness declined in past 20 years
absolute humidity increased from 1980 to 2020
But no conclusions can be reached about clouds or absolute humidity because of inaccurate data.
https://honestclimatescience.blogspot.com/
Nasa's CERES system has accurately measure earth albedo since 2021 and it has gone down by 1.5% .
i
CERES measures the amount of energy reflected by Earth and emitted by the planet into space. This includes both solar radiation reflected by the Earth's surface and atmosphere and the Earth's own thermal infrared radiation.
absorbed solar energy has increased in the past 20 years
but there is no way to differentiate between likely causes :
The effect of ONLY changes in clouds is unknown.
The fraction of sunlight reflected back into space, has been decreasing, primarily due to a combination of factors . These include:
The shrinking of Arctic and Antarctic sea ice and snow cover exposes darker surfaces like the ocean or land, which absorb more solar radiation instead of reflecting it. This has a significant impact on planetary albedo, as the Arctic's albedo change alone contributes significantly to radiative heating, according to a study published in PNAS.
Changes in Cloud Cover:
A decline in low-level clouds, particularly over the Atlantic, has been identified as a major contributor to the reduced albedo. This can be due to various factors, including internal variability, emerging low-cloud feedback, and aerosol effects.
Urbanization:
The expansion of urban areas, which often involves replacing high-albedo surfaces like fields and forests with low-albedo materials like asphalt and concrete, reduces the overall albedo.
Deforestation:
Cutting down trees and replacing them with crops or other land uses can also decrease albedo, as forests generally have higher albedo than other land cover types.
Pollution:
Soot and dust from industrial processes and burning fuels can settle on snow and ice, reducing their reflectivity and causing them to melt faster.
Biological Factors:
Red snow algae, which can grow on snow and ice, also reduce albedo and accelerate melting.
For absolute accuracy, CERES strives for 1% and 0.5% (1σ) for shortwave (SW) and longwave (LW) measurements, respectively.
CERES aims for a measurement precision of ±0.5% for broadband longwave radiances and ±1.0% for shortwave radiances.
I am not a climate scientist, in my job I did have to be observant and have worked in the tropics, desert and mountain areas. I have observed that no matter where i am, when a cloud passes overhead, it gets cooler. The last time I looked, NASA could not predict cloud cover. Very specifically, during the gulf war when Saddam lit the oil fields on fire, the sun was blocked out and the desert was much cooler. This persisted over a large area. Actual experience. Of course we have forever been warned about nuclear winters should the unthinkable ever occur. The water vapor cycle is the most important cycle and we do not really understand it and it is not brought to the public in any meaningful way. Though there was a Nova presentation called Earth from Space that went into depth on the water cycle. Fascinating and that cycle has been going on since earth began. Hotter or cooler, doesnt matter, the cycle continues and is basically the Earths thermostat.