We often complain about the manipulations and modifications of the surface weather record, not to mention the fact that the sample size keeps changing and many places around the world have to be filled in with guesses since there are no thermometers. So the world owes a great debt of thanks to Roy Spencer and John Christy of the University of Alabama in Huntsville (UAH) who in the early 1990s figured out a way to take data NASA was already collecting (microwave emissions from oxygen in the atmosphere) and convert it into a complete sample of air temperatures for the global lower troposphere, the part of the atmosphere up to about 10 km. This yielded a temperature series starting in 1979 that has continued to the present. At first the scientific world was jubilant and showered Spencer and Christy with high honours. But then they noticed that the UAH series, as it came to be called, wasn’t warming the way models said it should. And from then on it’s been a battle of the experts to find any reason possible not to mention the satellite data. So today we will tell you how to #lookitup yourself.
The current lower troposphere (LT) record is shown in this chart (and the real #LookItUp keeners can find the actual data in table format at this link) and there’s an updated version of this chart posted every month at Dr. Roy Spencer‘s blog:
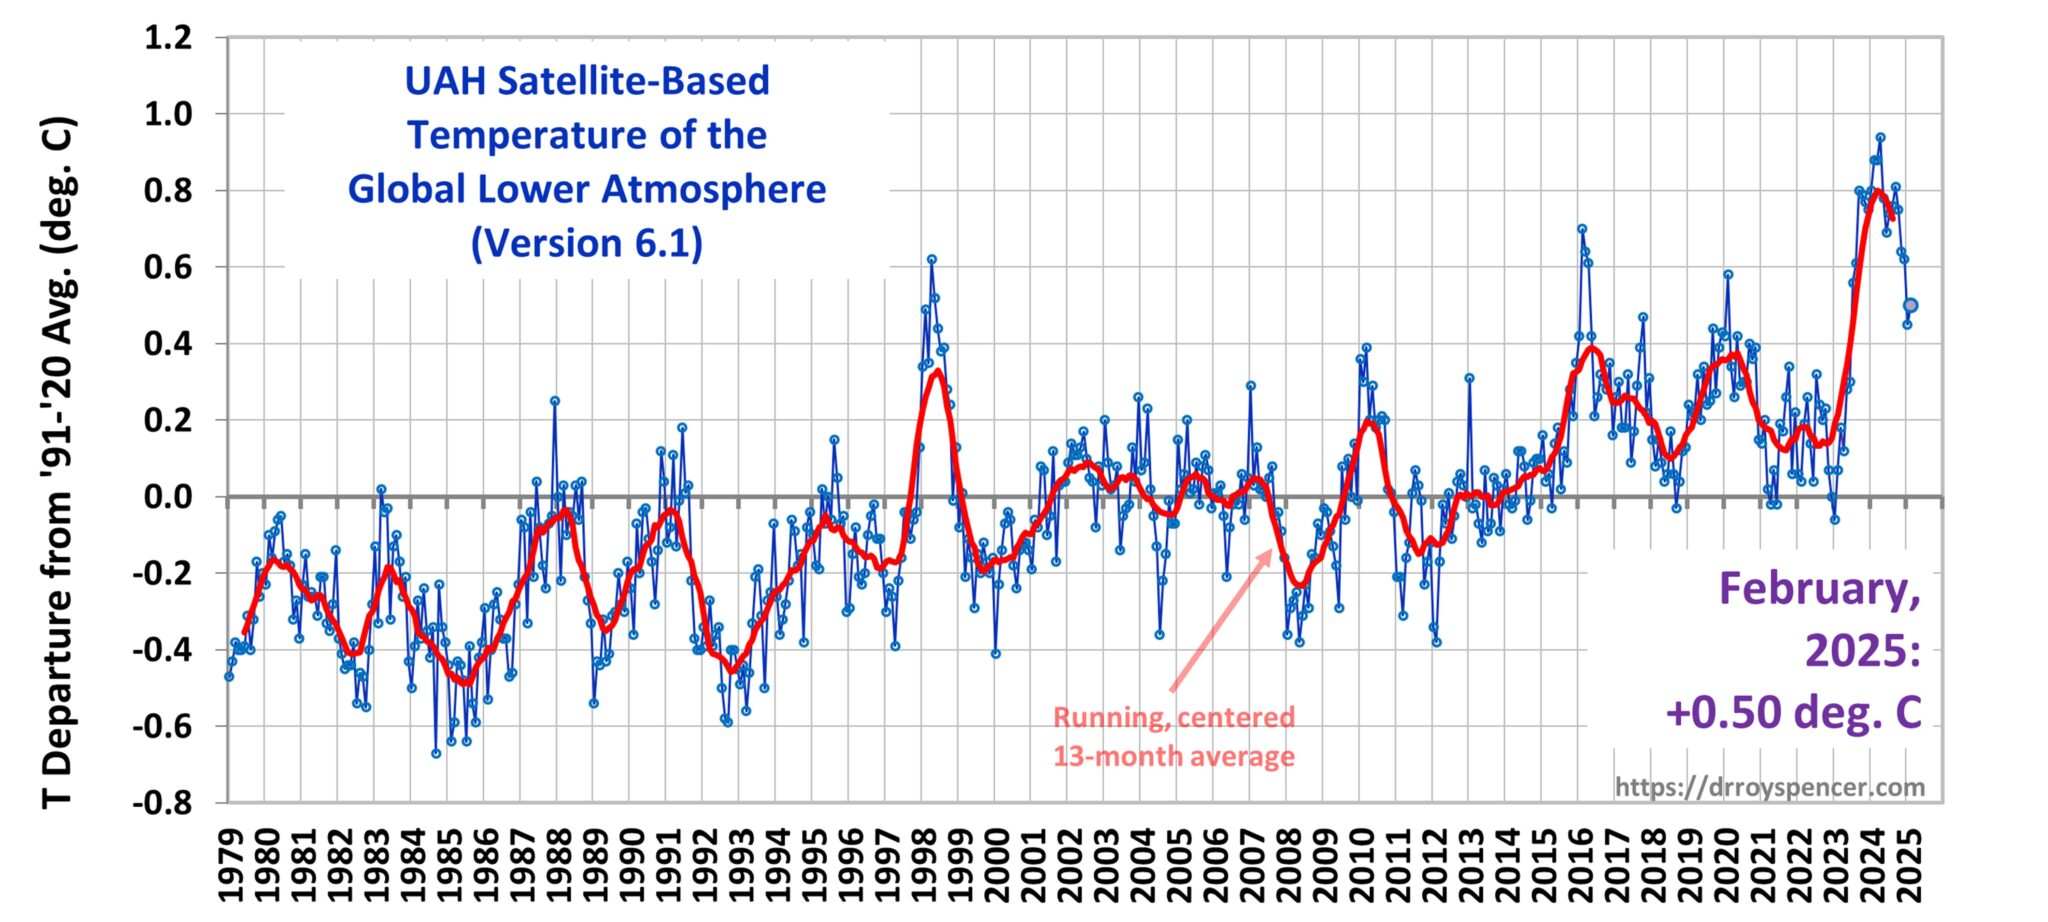
The series plainly shows that from the late 1990s to 2015 there was no warming going on at all, a period that came to be called the “hiatus”. (Perhaps because it sounded better than “the theory was wrong” because it implied that the warming was ongoing even when it wasn’t.) Then there was a pair of El Niños in 2016 and 2019 followed a surge of warming in 2023 which as we have noted, scientists can’t explain but don’t attribute to CO2.
The UAH satellite series covers three layers of the atmosphere, the lower and mid-tropospheres and the stratosphere. The troposphere being the lowest portion of the atmosphere, from ground level up to 6 km at the poles in winter and around 18 km in the tropics (and containing around 80% of the atmosphere by mass, about 99% of the water vapour and aerosols, and almost all the weather) and the stratosphere being immediately above it and reaching up to around 50 km above the Earth’s surface.
The lower troposphere, or “LT” if you want to sound cool to people who aren’t, is particularly important because the models say it’s where the greenhouse gases mix and the warming should be clearly observed. Indeed they predict that it should be warming faster than the surface. And yet for decades the LT has been warming more slowly than the surface, a distinctly uncool finding for the “climate science community” because it ought to be a clue that the surface data has a warming bias, if they were interested in following clues.
Fortunately Spencer and Christy are, and they now have a long enough data series to investigate how sensitive the real climate system is to greenhouse gases based on the satellite-measured response in the LT, far away from contamination due to urban heat islands, deforestation and all the other problems in the surface record. They recently computed that the climate sensitivity to CO2 doubling, “ECS” for Equilibrium Climate Sensitivity to the uncool, is about 1.9 degrees C, below the low end of the range coded into the IPCC’s models, but in line with lots of empirical studies as we showed in our series #ECS in the real world. And low enough to confirm that even if the warming continues for a century or more, it is not a crisis.
We encourage you to follow the progress of the UAH LT series especially in the coming months as we watch to see if the warming surge of 2024 continues to fade away. In the end science depends on having good quality data, and knowing how to #lookitup.


Important to note that CO2 is not going to double from 400ppm to 800ppm anytime soon. Given over 95% of increasing CO2 is natural (less than 5% human) at a total CO2 rate of say 2.5ppm/year would take 400ppm/2.5 =160 years and primarily natural. We will not make a difference attempting to reduce CO2, and plants won't thank us for trying as they enjoy this extra CO2/ plant food.