This week we go back to the NOAA Climate at a Glance website to see just how much worse droughts are getting. Why do we think they’re getting worse? Well because everyone says so, and climate change is making everything worse, and any time there’s a story about climate change on the TV there are pictures of drought-ravaged landscapes. But then again, maybe we should check the data, which is easy to do if you know where to #Lookitup. So here is the monthly record of drought severity (negative means drier) for the contiguous US from 1895 to 1925. Spot the trend if you can:
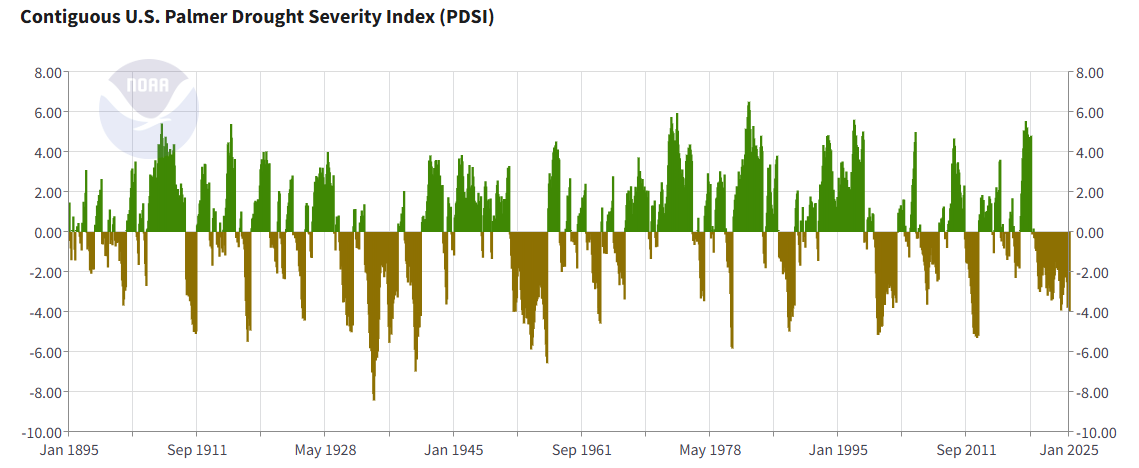
The top 10 months for extreme dryness were all before 1957, and indeed 7 of the top 10 were all in the year 1934. The first post-2000 entry is January 2013 which appears at number 30 on the list. The 2020s have been dry, following a decade of mainly wet years. But there doesn’t appear to be a pattern one way or the other. So next time someone says climate change is making droughts across the US get worse and worse, challenge them to #lookitup.
See Comments 
#LookItUp: US drought severity
12 Mar 2025 | Science Notes


The trend is that there is no trend...very trendy!
"for the contiguous US from 1895 to 1925"..
2025, surely?
Yes, 2025 according to the graph