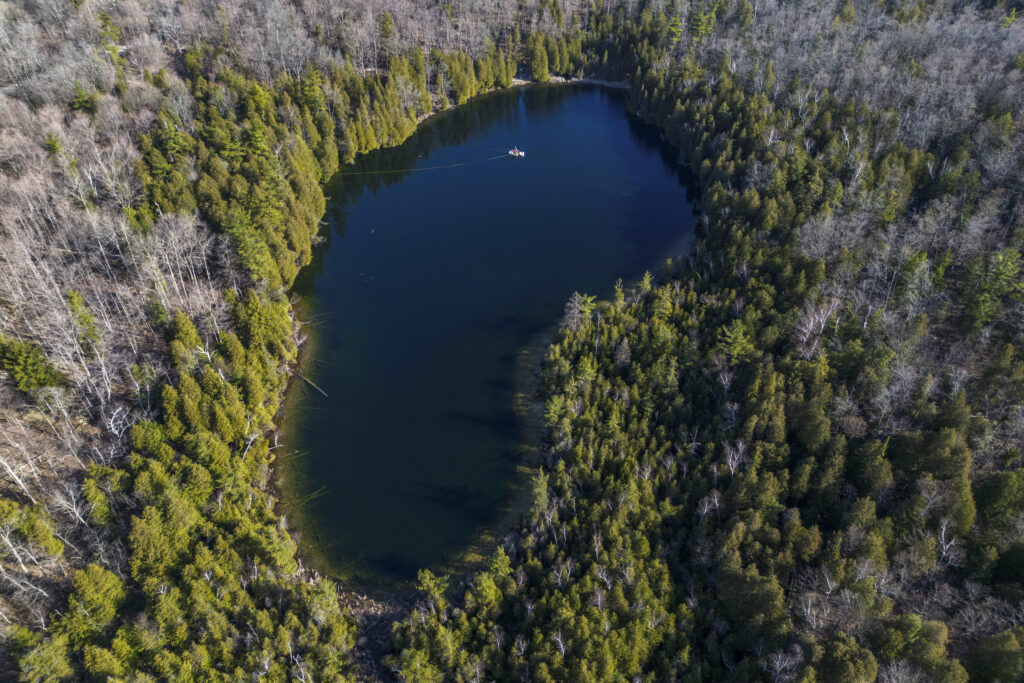
From the CO2Science Archive: The authors conducted a high-resolution analysis of midge assemblages found in the sediments of Moose Lake (61°22.45’N, 143°35.93’W) in the Wrangell-St. Elias National Park and Preserve of south-central Alaska (USA), based on data obtained from cores removed from the lake bottom in the summer of AD 2000 and a midge-to-temperature transfer function that yielded mean July temperatures (TJuly) for the past six thousand years. The results of the study are portrayed in the accompanying figure, where it can be seen, in the words of Clegg et al., that “a piecewise linear regression analysis identifies a significant change point at ca 4000 years before present (cal BP),” with “a decreasing trend after this point.”
Paper reviewed: Clegg, B.F., Clarke, G.H., Chipman, M.L., Chou, M., Walker, I.R., Tinner, W. and Hu, F.S. 2010. Six millennia of summer temperature variation based on midge analysis of lake sediments from Alaska. Quaternary Science Reviews 29: 3308-3316.
From 2500 cal BP to the present, there is a clear multi-centennial oscillation about the declining trend line, with its peaks and valleys defining the temporal locations of the Roman Warm Period, the Dark Ages Cold Period, the Medieval Warm Period, the Little Ice Age – during which the coldest temperatures of the entire interglacial or Holocene were reached – and, finally, the start of the Current Warm Period, which is still not expressed to any significant degree compared to the Medieval and Roman Warm Periods.

Mean July near-surface temperature (degC) vs. years before present (cal BP) for south-central Alaska (USA). Adapted from Clegg et al. (2010).
What it means
In discussing their results, the seven scientists write that “comparisons of the TJuly record from Moose Lake with other Alaskan temperature records suggest that the regional coherency observed in instrumental temperature records (e.g., Wiles et al., 1998; Gedalof and Smith, 2001; Wilson et al., 2007) extends broadly to at least 2000 cal BP,” while noting that (1) climatic events such as the LIA and the MWP occurred “largely synchronously” between their TJuly record from Moose Lake and a δ18O-based temperature record from Farewell Lake on the northwestern foothills of the Alaska Range, and that (2) “local temperature minima likely associated with First Millennium AD Cooling (centered at 1400 cal BP; Wiles et al., 2008) are evident at both Farewell and Hallet lakes (McKay et al., 2008).”
In closing, it is instructive to note that even with the help of the supposedly unprecedented anthropogenic-induced increase in the atmosphere’s CO2 concentration that occurred over the course of the 20th century, the Current Warm Period has not achieved anywhere near the warmth of the MWP or RWP, which suggests to us that the climatic impact of the 20th-century increase in the air’s CO2 content has been negligible, for the warming that defined the earth’s recovery from the global chill of the LIA -- which should have been helped by the concurrent increase in the air’s CO2 content -- appears no different from the non-CO2-induced warming that brought the planet out of the Dark Ages Cold Period and into the Medieval Warm Period.
References
Gedalof, Z. and Smith, D.J. 2001. Interdecadal climate variability and regime scale shifts in Pacific North America. Geophysical Research Letters 28: 1515-1518.
McKay, N.P., Kaufman, D.S. and Michelutti, N. 2008. Biogenic-silica concentration as a high-resolution, quantitative temperature proxy at Hallet Lake, south-central Alaska. Geophysical Research Letters 35: L05709.
Wiles, G.C., Barclay, D.J., Calkin, P.E. and Lowell, T.V. 2008. Century to millennial-scale temperature variations for the last two thousand years inferred from glacial geologic records of southern Alaska. Global and Planetary Change 60: 115-125.
Wilson, R., Wiles, G., D’Arrigo, R. and Zweck, C. 2007. Cycles and shifts: 1300 years of multi-decadal temperature variability in the Gulf of Alaska. Climate Dynamics 28: 425-440.


“Midge assemblages”…..So “no-see-um” bodies found in a cores 3” in diameter randomly taken from lake bottoms ? …..I don’t buy it….even more inaccurate than looking at pollen layers, which depend on which direction a windy storm came from during the 10 days the grasses were in flower….Tree rings would be much better, but even they are a proxy for rainfall first and temperature second….
There are huge flying insect population variations from year to year. The hypothesis that bug body counts at lake bottoms are going to tell you the temperature sounds sciency, but is simply a fantasy in the minds of people who don’t get outdoors much and aren’t in touch with the real Mother Nature at all….have they compared the last couple of decades of lake bottom “midge assemblages” with bug repellant sales to see if number of bugs correlates ? I mean, that’s just as sciency of a supposition.
Maybe instead it is a proxy for how many bats were flying around eating midges….thus they actually were measuring a proxy for the evolution of bat viruses….let’s just call this what it is…. pseudoscience.
It seems common sense is not so common unless it coincides with the narrative.