This one will take us more than a week to go through, because it’s a whole website full of cool climate data. Climate4you.com is a project of Ole Humlum, Emeritus Professor of Physical Geography at the University of Oslo, Norway. Professor Humlum believes, as we do, that the whole discussion about climate change would be a lot more sensible and scientific if it was based on data rather than hysterical shouting and sloganeering. Yeah, yeah, we know that makes us irrelevant old fogies in our brave new post-scientific world, but so be it. Hang around CDN and you’re going to see the numbers, like it or not. Beginning with the big picture over geological time. And we can’t help noting that it’s very often retired professors who speak out because of the career-destroying intimidation facing any younger academics who dare question official orthodoxy, even if speaking out amounts simply to showing people the raw data.
If you’re not sure just how long geological time is, or you’re confused by our occasional mention of things like the Pleistocene or the Lower Cretaceous, well, it’s very long indeed and there are lots of eras, never mind periods, epochs or mere ages. So here’s the chart, courtesy of Professor Humlum:
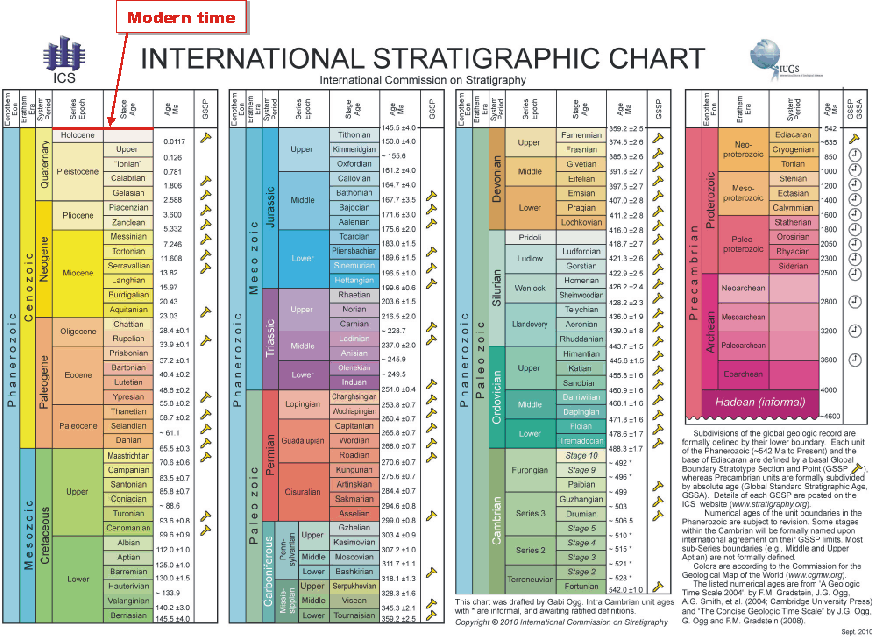
Notice that the time scale is not uniform; the right-hand column covers four billion years, the others just a couple of hundred million or, on the far left, a mere 145 million. Notice also the thin red band at the top marking out “Modern time”, which means the tail end of the Holocene, itself a minor segment of the Quaternary, which is just the latest blip in, drum roll please, geological time. Aka “time as the Earth keeps it”. During which the climate has swung back and forth between hothouse eras with tropical forests in today’s polar regions, and icehouse conditions with the opposite.
Now if we zoom in on the latter part of the Pleistocene, “just” the last half million years of the Earth’s climate (we told you geological time was long; the Pleistocene itself, the “Ice Age” we’re still in even if we vaingloriously dub our current interglacial a separate “epoch”, has lasted 2.8 million years which is itself only a blip on a planet over 4 billion years old on which complex multicellular life has existed for over half a billion), we see the following remarkable picture:
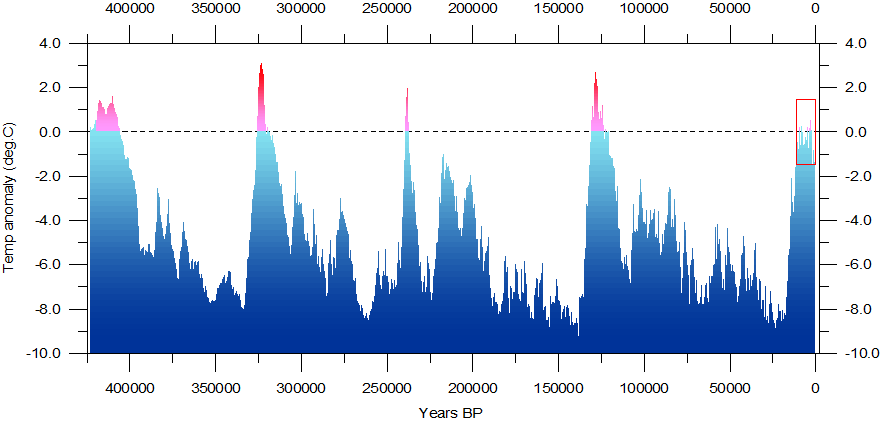
There are three things we particularly want to draw to your attention here. First, the rare, short, pink-colored peaks during which the Earth’s land surface was generally livable are brief little spikes amidst long frozen depths of deep glaciations in the last half-million years.
Second, during this period the climate constantly changes, and quickly. There are no smooth trends, just rapid jumps up and down even within glaciations. So anyone who says today’s slowly warming climate is proof that something unprecedented is happening has a point: normally the swings are much bigger and wilder.
Third, the present interglacial period, shown by the red rectangle, the “Holocene”, is actually cool compared to the previous four. Indeed it barely qualifies as an interglacial. It’s cooler now than it was every other time we broke through the ice over the last half-million years, and every one of those temperature peaks was of course natural.
Oh, one more thing. The latest warmish period is rather long as these things have gone during the Pleistocene, which means if we were going to project anything for the centuries ahead, a sudden drop into a new ice age would be the most plausible forecast.
P.S. And if you’re wishing more people could see this kind of information, why not slip on a CDN t-shirt showing half a million years of climate change and do your part to educate the public? Everyone would tell you you’re pretty cool.


Hi,
There is another Norwegian web site you should check out.:
https://verstat.no/vaerstat-articles-in-english/
Well, I just bought a t-shirt for 44 dollars lol. But it w was worth it! I might just buy another one as a gift for one of my more extreme weeny greeny friends;-) Maybe you should too, yes, you!
The most telling feature of that chart showing the long glacial periods is that it appears we are slipping back into one (in geological time). More Co2 please, sir!
"During which the climate has swung back and forth between hothouse eras with tropical forests in today’s polar regions..."
The problem with this claim is that the tropical forests of today's polar regions grew up when the tectonic plate they were growing on was much closer to the equator. Pretty much all of the land in the polar regions today have arrived there since the dinosaurs went extinct. They lost their tropical growth as they split and drifted north and south.
Are you suggesting that, during the periods of high temperatures at the peak of the graphs, the polar regions were still covered in ice?