Or more precisely, climate models run too hot when simulating US surface temperatures. This was the conclusion of climatologist Roy Spencer when he examined 36 modern climate models and compared how much warming they produce over the US land surface over the past 50 years (1973 to 2022) when fed the observed increase in greenhouse gases. Many of the models showed too much warming. No wait, most of the models. No, hold on. All of them. Every single solitary one of the models warmed too much compared to observations. So it’s not just random error, it’s a big hot red thumb on the scale.
Here are Spencer’s findings:
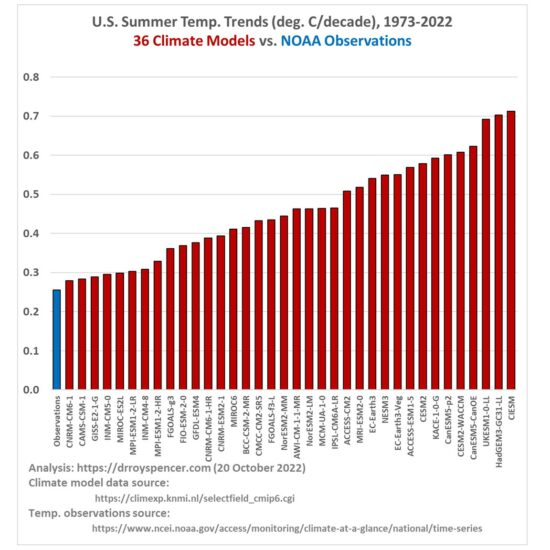
The red bar heights show the simulated warming trends in degrees C per decade. The blue bar shows the trend according to the US National Oceanic and Atmospheric Administration. Spencer has also criticised that data for being upwardly-biased due to urbanization. But even if we set that significant caveat aside, the observed trend is +0.26 degrees C per decade whereas the model-simulated trends ran from +0.28 to +0.71 degrees C/decade.
It’s the kind of discrepancy you get when the models are biased. If they were merely inaccurate the errors would be distributed randomly, with some running too hot and some too cold. But when they all get it wrong in the same direction, it takes planning. And they wonder why we don’t trust the models. Or those who do trust them. Or the modelers.


")
Don’t forget, NOAA also modifies their temperature record to artificially show a greater increase in temperatures from the 30s through today by subtracting from the earlier years then gradually shifting to adding more and more to the more recent years. Without this there has been very little warming and the model predictions would all greatly dwarf the actual changes.