From CO2Science: In the words of Xu et al. (2020), net primary productivity (NPP) is “a measure of the net amount of solar energy converted to chemical energy through photosynthesis, providing a valuable indicator of ecosystem vitality and function in Earth systems science and global change research.” With the advent of satellites, scientists have been measuring and archiving data on this parameter for ecosystems all across the globe. And now, with the passage of time, these data sets are proving a treasure trove of information on vegetative health all across the globe. As their contribution to this topic, Xu et al. analyzed NPP data at a spatial resolution of 1 km for coastal China (between 3.33-43.48 °N and 104.43-125.78 °E) over the 30-year period 1986-2015. And what did that analysis reveal?
Paper reviewed: Xu, X., Jiang, H., Guan, M., Wang, L., Huang, Y., Jiang, Y. and Wang, A. 2020. Vegetation responses to extreme climatic indices in coastal China from 1986 to 2015. Science of the Total Environment 744: 140784, doi.org/10.1016/j.scitotenv.2020.140784.
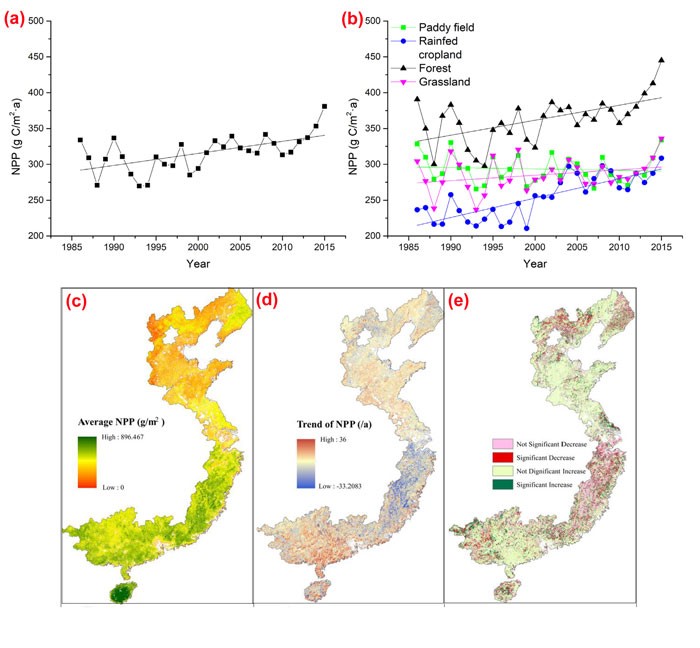
Among their key findings the authors report NPP increased across 73.71% of the total land area of coastal China, indicating “an overall greening trend.” The linear trend in NPP for the region, shown in Figure 1a, was calculated to be an average increase of 1.67 g C m-2 yr-1. Paring down the data into four specific ecosystem types, Xu et al. further determined that NPP rose by 2.09, 2.71, and 0.76 g C m-2 yr-1 for forest, rainfed cropland, and grassland ecosystems, while in rice paddy fields it declined by a modest 0.19 g C m-2 yr-1.
The overall greening trend of coastal China, in the words of the authors, “is consistent with global-scale studies of NPP as well as those focusing on arid regions.” Indeed, links to reviews to dozens of such analyses can be found in the Subject Index under the heading Greening of the Earth on this page.

Figure 1. Upper portion: Inter-annual variations in Net Primary Productivity (NPP) across (a) all ecosystems of coastal China and across (b) specific ecosystem types for the period 1986-2015. Lower portion: spatial display of (c) average NPP, (d) its 30-year trend, and (e) trend significance. The significance level (p) was set at 0.05. Source: Xu et al. (2020).


