From CO2Science: Among the seemingly endless predictions of climate alarmism is the concern that rising temperatures are reducing planetary snow cover. But is this correct? A recent paper by Sun et al. (2020) suggests it is not, reporting instead that a large portion of Eurasia shows “no significant positive or negative interannual trends of snow cover extent from 2000 to 2016.” In the present review, we report the findings of another peer-reviewed paper published in 2020 that also undermines climate alarmist claims. Using remotely-sensed Moderate Resolution Imaging Spectroradiometer (MODIS) satellite data, Ahmad et al. (2020) evaluated spatio-temporal trends in annual and seasonal snow cover in the Chitral River Basin of Hindukush, Pakistan, over the period 2000-2016. Located between 36°-37° N and 71°-74° E, the Chitral River Basin is a major drainage artery for snow/ice in the Hindukush region and has a mean elevation of ~4,200 m ASL. In calculating trends in snow cover area (SCA), the authors utilized nearly 800 MODIS snow images over the 17-year period. So what did their study reveal?
Paper reviewed: Ahmad, S., Israr, M., Liu, S., Hayat, H., Gul, J., Wajid, S., Ashraf, M., Baig, S.U. and Tahir, A.A. 2020. Spatio-temporal trends in snow extent and their linkage to hydro-climatological and topographical factors in the Chitral River Basin (Hindukush, Pakistan). Geocarto International 35: 711-734.
Ahmad et al. report monthly SCA in the Chitral River Basin varies between 21% and 92%, with the latter percentage occurring in March and the former in August. After removing a seasonal effect on the data, Ahmad et al.’s analysis revealed mean monthly snow cover across the entire basin experienced a statistically significant increase of 0.32% per year (see Figure 1a). Such positive trends were also noted when separately analyzing SCA data by snow accumulation (Oct-Mar) and snow melt (Apr-Sep) months, though the trends were not statistically significant (see Figure 1b). Ahmad et al. also evaluated SCA trends according to five separate elevational bands within the Chitral River Basin, finding “an increasing trend in snow extent in all zones” that was significant in all but one zone (a zone between 2,501 and 3,500 m ASL).
As for why SCA trends are not decreasing, the answer to that question is found in the authors’ additional analysis of basin climate records. Illustrated in Figure 1c, trends analysis reveals “stable trends in annual precipitation and a significant decrease in the mean annual temperature.” Consequently, the authors suggest the observed decline in temperatures has likely led to less snow melt and, hence, greater SCA over the 17-year observational period. And none of these observations suggest a climate catastrophe because of rising atmospheric CO2.
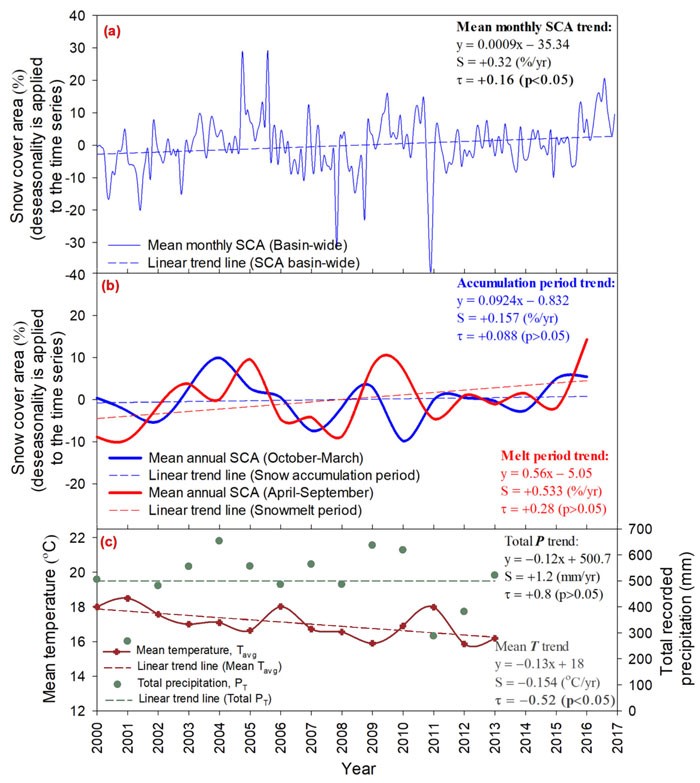
Figure 1. Snow cover area (SCA) trends in the Chitral River Basin, Hindukush, Pakistan (2000-2016). Panel (a): trends in mean monthly SCA. Panel (b): trends in SCA during snow accumulation and snowmelt periods. Panel (c): trends in the mean annual temperature (Tavg) and total precipitation (PT), over 14 years of available and overlapping SCA data (2000-2013). Mean temperature and total precipitation are averaged from the two weather stations as discussed in the authors’ text. Linear trends (dashed lines) and equations are given in each panel along with Mann-Kendall’s trend test “τ” and Sen’s slope estimator “S”. Source: Ahmad et al. (2020).
Reference
Sun, Y., Zhang, T., Liu, Y., Zhao, W. and Huang, X. 2020. Assessing snow phenology over the large part of Eurasia using satellite observations from 2000 to 2016. Remote Sensing 12: 2060, doi:10.3390/rs12122060.


The Hadcrut5 data just released this month shows that there was no increase in global average temperature between 2015 and 2020 (actually a minimum decline of 0.029 degrees per decade). While the two periods are the same, this six year overlap may help explain the increase in snow.