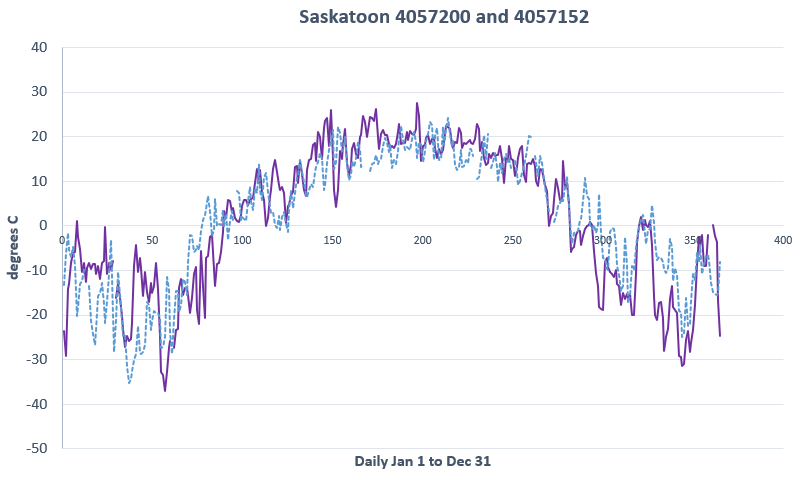
On the prairies you can see the weather coming from far away. But if you want to see climate change, you might have to squint hard. One of these lines is the daily temperature record for Saskatoon (where they wanted a real hill for the kids so they had to build one) in 1919 and one for 2019. Can you tell which is which? Take a guess then click on the link to see the right answer.
Here’s the chart with the lines labeled:
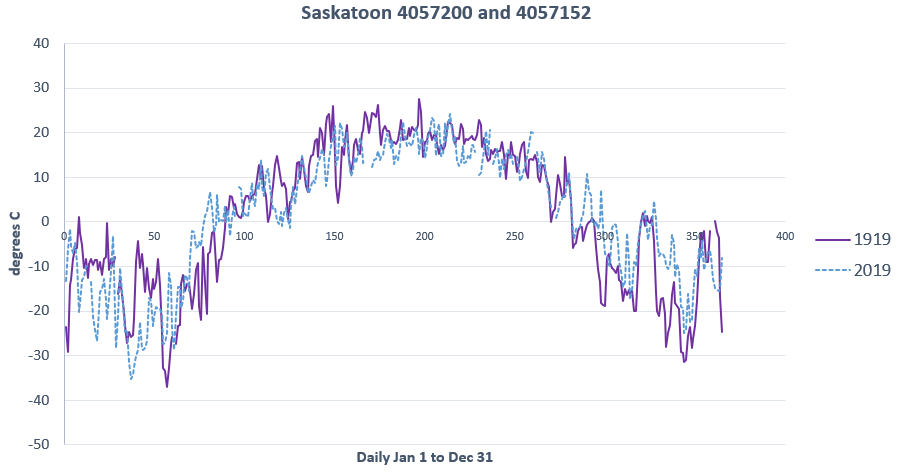
The solid purple line is 1919 and the blue dashed line is 2019. Didn’t see that coming, did you? And if you found it hard to tell, that means that if you were around in 1919 you’d have noticed a lot of differences around you by 2019 including the construction of man-made Optimist Hill. But you wouldn’t have noticed the weather being different.
See Comments 
1919 or 2019: Really Flat Place Edition
15 Apr 2020 | 1919 or 2019, Science Notes


I used to think that the line with the greater number of discontinuities would be the older temperature series, on the conjecture that meteorologists just weren't as rigorous in the old days. But that conjecture is refuted week after week. So I have another: 100 years ago, the data were collected by interested volunteers, who thought it important to have complete and accurate records; whereas today, the date are collected by unionized public servants who have generous "sick days" allowances in their contracts, so they can afford to miss days here and there throughout the year when convenient.
I am now able to tell which graph is which every time. The one that is slightly warmer at the end of the year and slightly colder at the beginning of the year is the current one. As a gardener I can tell you that spring comes later than it used to and Christmas cold snaps aren’t as frequent. Is love to see the graphs for vancouver.
Regrdless of interested voluteers or unionized workers, look at the results and how they correlate! They are not doing micro-surgery! They are recording a temperature on a theromometer!!!
The issue is the mean temperature difference. For a meaningful comparison CDN should report the annual mean temperatures for both years.
if the two graphs are within noise of each other, any difference in area under curve is also noise. There will inevitably be a difference, but it will be difficult to ascribe much meaning to it.
I'm more interested to see the source for the number.
Like the other commenters I particularly appreciate this section of the CDN news letter. However, contrary to the view of another comment above, I do not think the seasons are necessarily changing, but I can identify the 2019 trace each time because I remember the warm December in North America.
Living in the UK I believe the weather patterns are entirely random and unpredictable. For example, this last winter we had very wet weather from November to mid-March with flooding. This was driven by a strong jet stream with many active depressions crossing the country with strong south-westerly winds. No snow and hardly a frost. The weather then changed abruptly and we are now in our fifth week of dry easterly winds with the pressure patterns completely reversed. The ground is now like iron. If we had had this pattern in January and February we would have had something approaching a Canadian winter!
I have lived in Saskatoon for the past 37 years. Before moving here, I grew up in various towns, within Saskatchewan. We have a saying here; if you don't like the weather, just cross the street. The most amazing reality of weather in Saskatoon, is how quickly we go from wearing winter jackets to wearing shorts and shirt sleeves, in a little over one month. Spring is crazy here. The one thing that I've noticed, during the spring season, is that we will almost always have snowfall for Easter. In contrast to this, I remember one particular Christmas day where the temperature reached 6 degrees Celsius! But weather anomalies aside, farmers have a good idea of when they should sow their fields, and Grandmas and Grandpas always know when it's best to start planting the garden. The weather is usually quite reliable, when looking at seasonal changes. Any anomalies that we experience are just that...anomalies. If anything, the prairies could do with a little warming. Farmers would not be forced to rush planting or harvest, in such small time frames as the seasons sometime allow. Though there may be deviations from time to time, the Saskatchewan people can rely on the weather to be basically static. We have a love / hate relationship with weather, as we rely on it for farming. People are either bitching because planting season was either too wet, or too dry, yet crops still get planted and harvested, and some years are harder than others. The weather in the prairies can be described as this...predictably unpredictable. Today's weather will be sunny and warm...unless it snows, or something like that.
Remember that CDN is addressing the issue of (supposed) global warming. Therefore, I believe that the maximum temperature is more relevant.
I have done similar graphs for other locations around Canada and they all look the same.... you can not differentiate between today and years ago (http://goinggreencanada.ca/images/CL_1955_2020.png). I also track some weather stations over long periods that do not show any warming. See http://goinggreencanada.ca/images/Cold_Lake_Temp.png --OR-- http://goinggreencanada.ca/images/North_Bay_Temp.png