OK, so maybe most Canadian cities on the Tour aren’t showing any signs of warming. But, we often hear, Canada's Arctic is warming much faster than the average, with devastating impact on its inhabitants including that “People traveling by snow machine on well-known routes fall through the sea ice with alarming frequency.” We feel that as a public service we should remind everyone that it is still very cold in the Arctic, and if you go up there this time of year in a t-shirt and flip-flops expecting hot weather, you may die. Climate change or not, the temperature record for Cambridge Bay Nunavut, which goes back to 1929, is conspicuously unchanged despite claims to the contrary.
The warmest maximum was back in 1930, while the coldest was in 1934. The warmest hourly mean was more recent, 2010, while the coldest was in 1972. Maybe this counts as a warming trend, but in a place where the average minimum is always in the minus 40s, it ain't much: 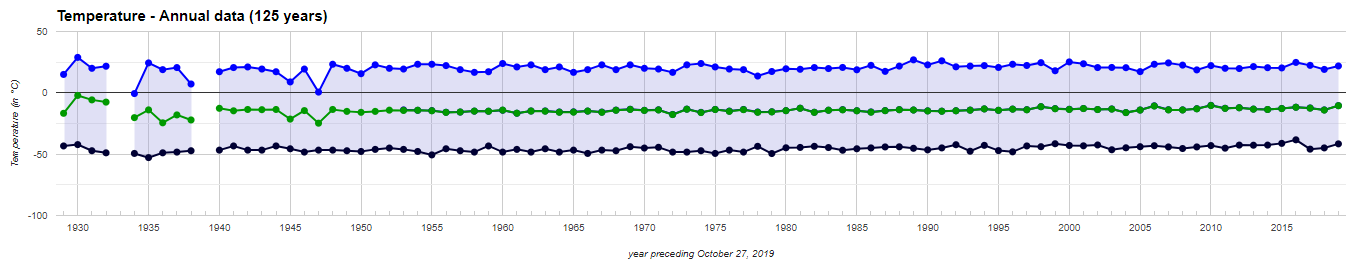
The amount of snow in Cambridge Bay bounces around from one year to the next but there's still lots of the white stuff: 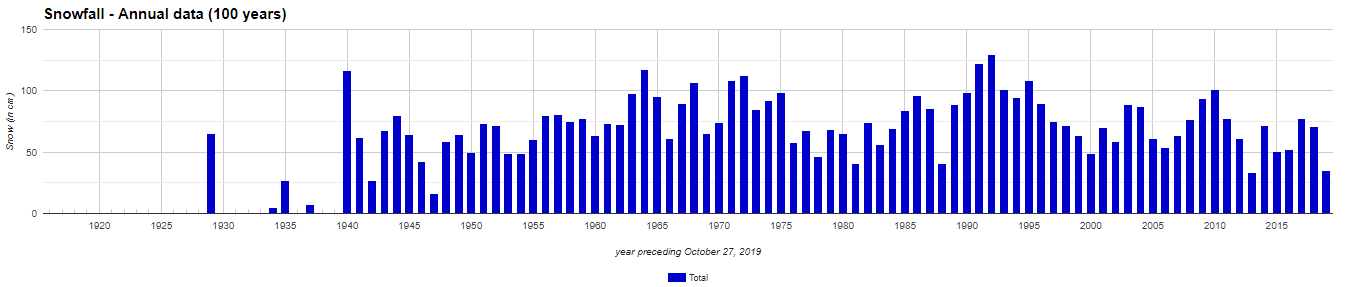
In fact the record for maximum snow on the ground was set in 2016: 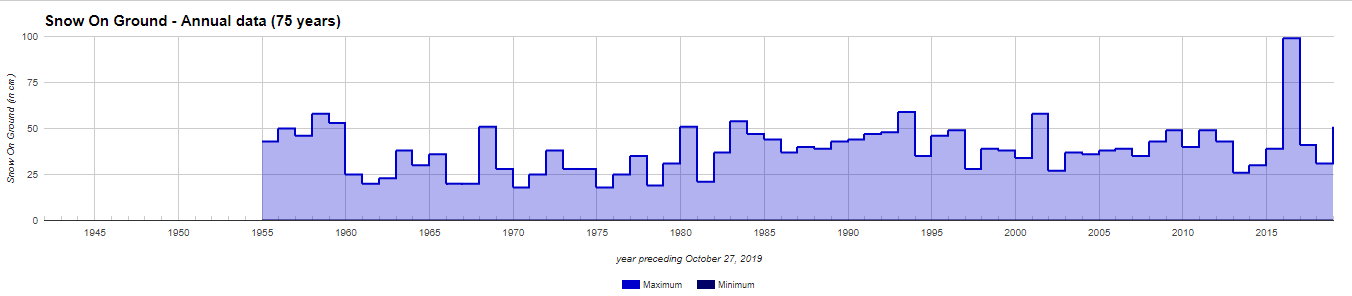
Like many places in Canada, average wind speed has declined somewhat: 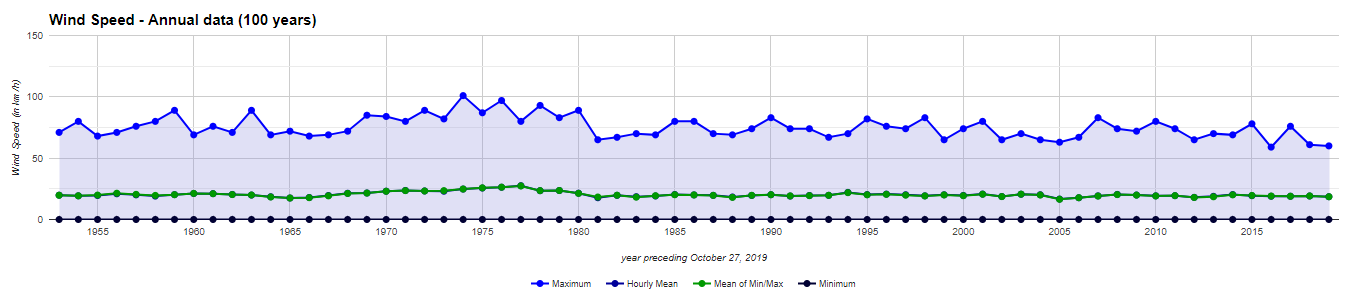
as has the maximum wind gust speed: 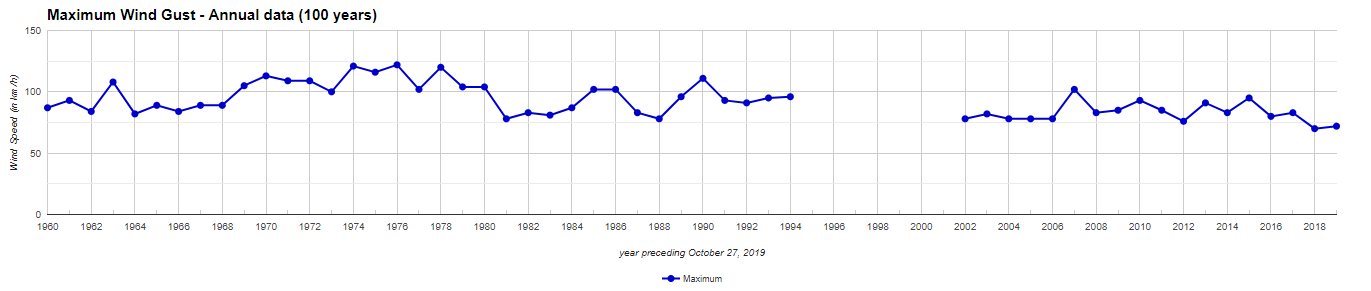
Less wind means less windchill, even in the Arctic: 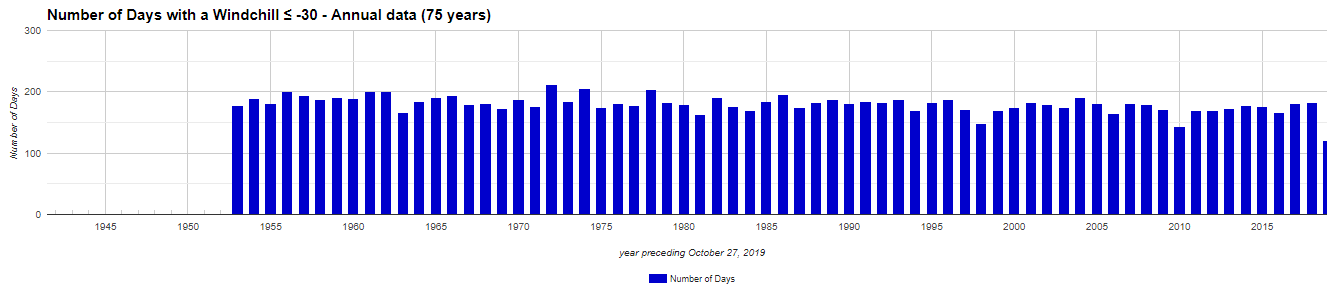
This record shows the number of days with windchill less than 30 degrees below zero. The number, amazingly enough, is almost always over 150 and often near 180, which means that nearly half the year in Cambridge Bay is spent under a windchill warning of under -30 degrees C.
The only climate emergency in Cambridge Bay is when southerners with heads full of global warming rhetoric show up without warm coats.


"In fact the record for maximum snow on the ground was set in 2016: "
I must be cock-eyed this morning, because I can't see how the bar graph shows this. 2016 seems to be quite low in accumulated snowfall. The tallest bar is in 1992.
I thought the same thing, but look down at next graph, it is labelled wrongly as “wind speed”. It is actually “snow on the ground” Very confusing.
And still, it looks all okay on my graphs. Way more snow for 2016 than any other year. Weather, weird stuff.
A very interesting data. We will keep an eye on the next developments.
Thank you for sharing this news!
It's long passed time this rhetoric was put to sleep, the constant bombardment regarding "Climate Change" is as we know pushed byt the WEF and the "Woke" idiots of the world, we have plenty of fossil fuels which we need to use.