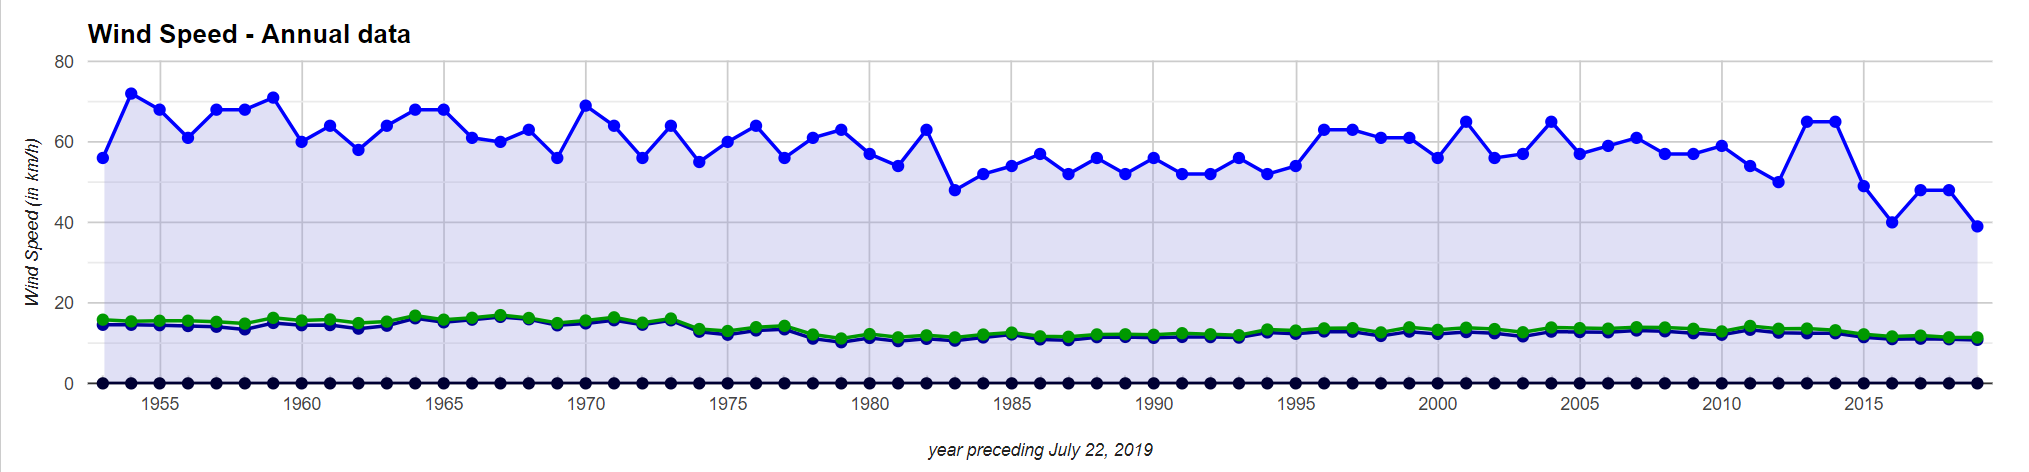
If you listen to its city councillors, Edmonton is facing a Climate Emergency. We prefer looking at the climate data, which is easily done courtesy of weatherstats.ca. Edmonton temperatures do show a pattern of change. The average nighttime minimum temperature has moved up since the 1880s, from the mid-minus 40s C to about minus 30 C. A change that large is probably due mainly to urbanization since the daily maximum has hardly changed, hitting a record of 37.1 C back in 1937, while the daily average reached a maximum in the 1980s and flattened out thereafter. Like many other cities we’ve examined, Edmonton is gradually getting less windy, and precipitation is about the same as it’s been since records began. If only every emergency looked like this one.
Here is the chart of temperatures:
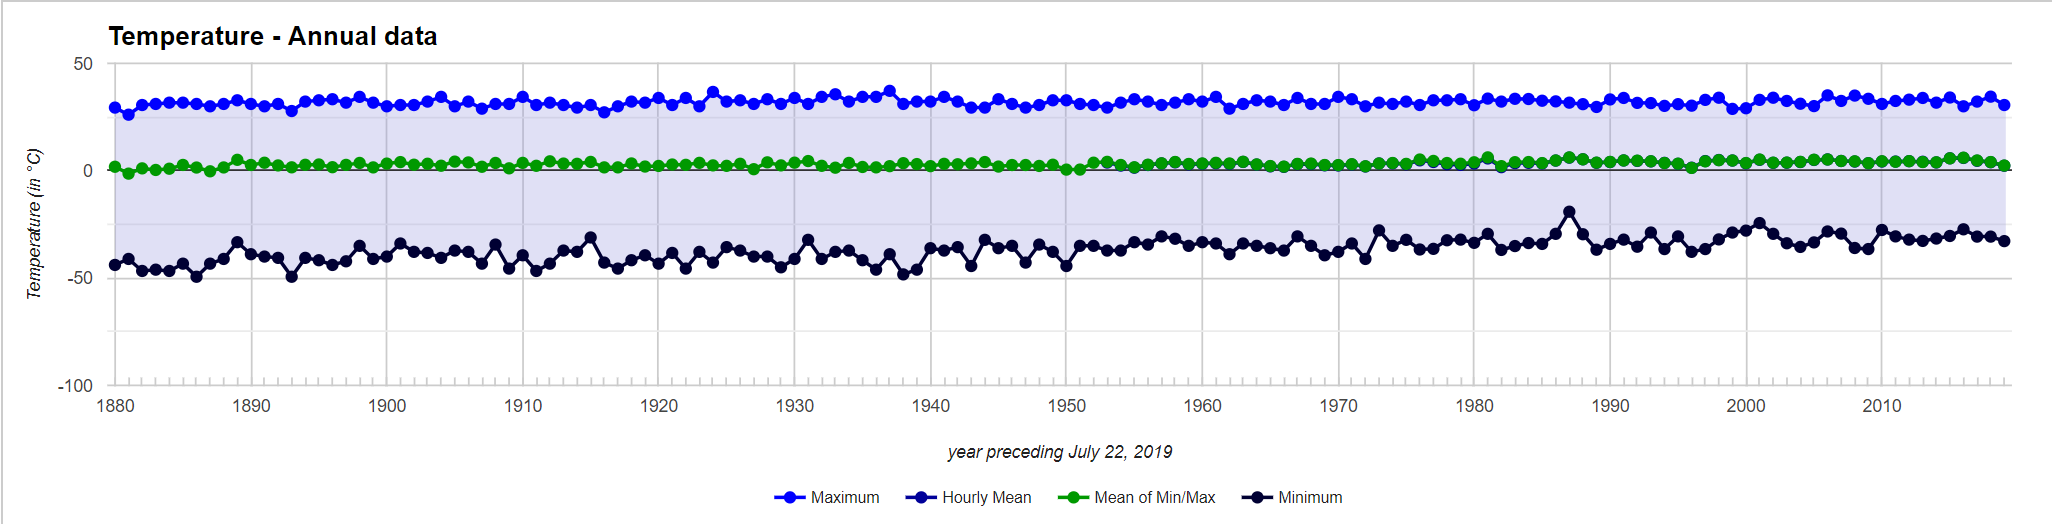
and here are the precipitation numbers:
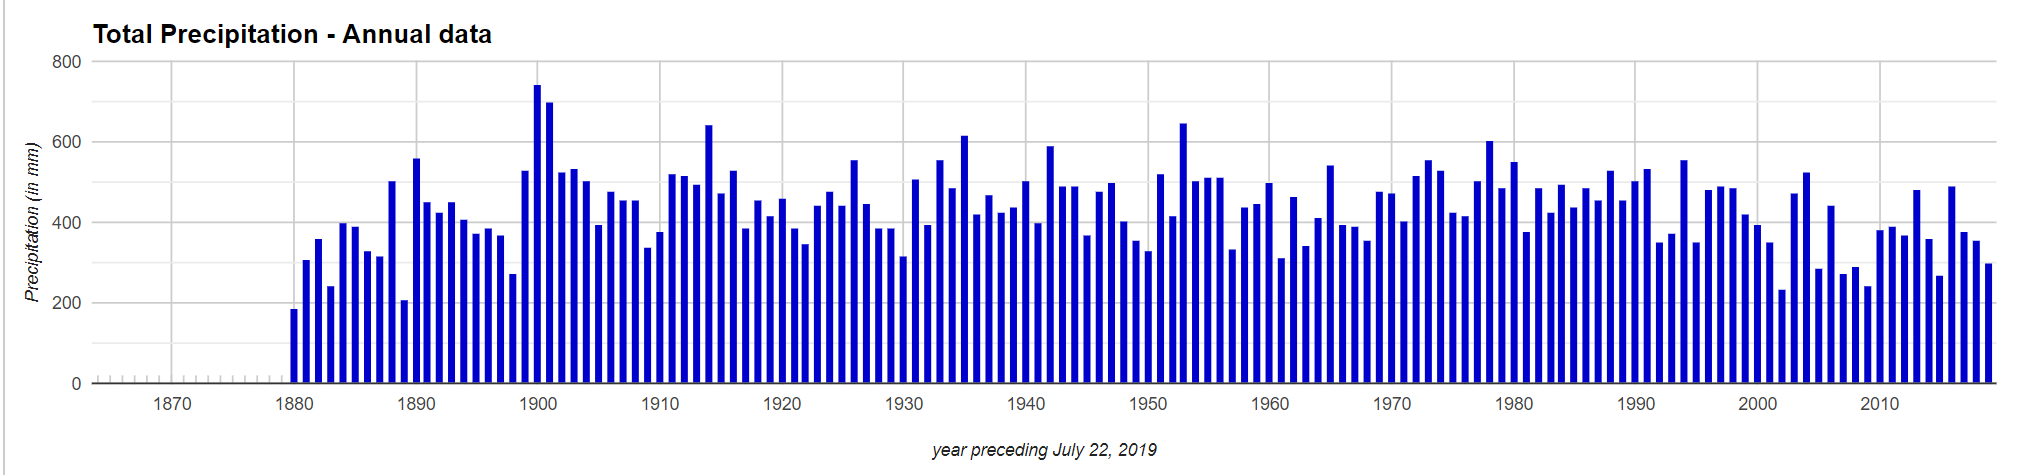
If today’s weather is an emergency, then Edmonton has been in a state of emergency for over a century. Which is another way of saying Edmonton is not in a state of emergency. Indeed winds are gradually getting milder:
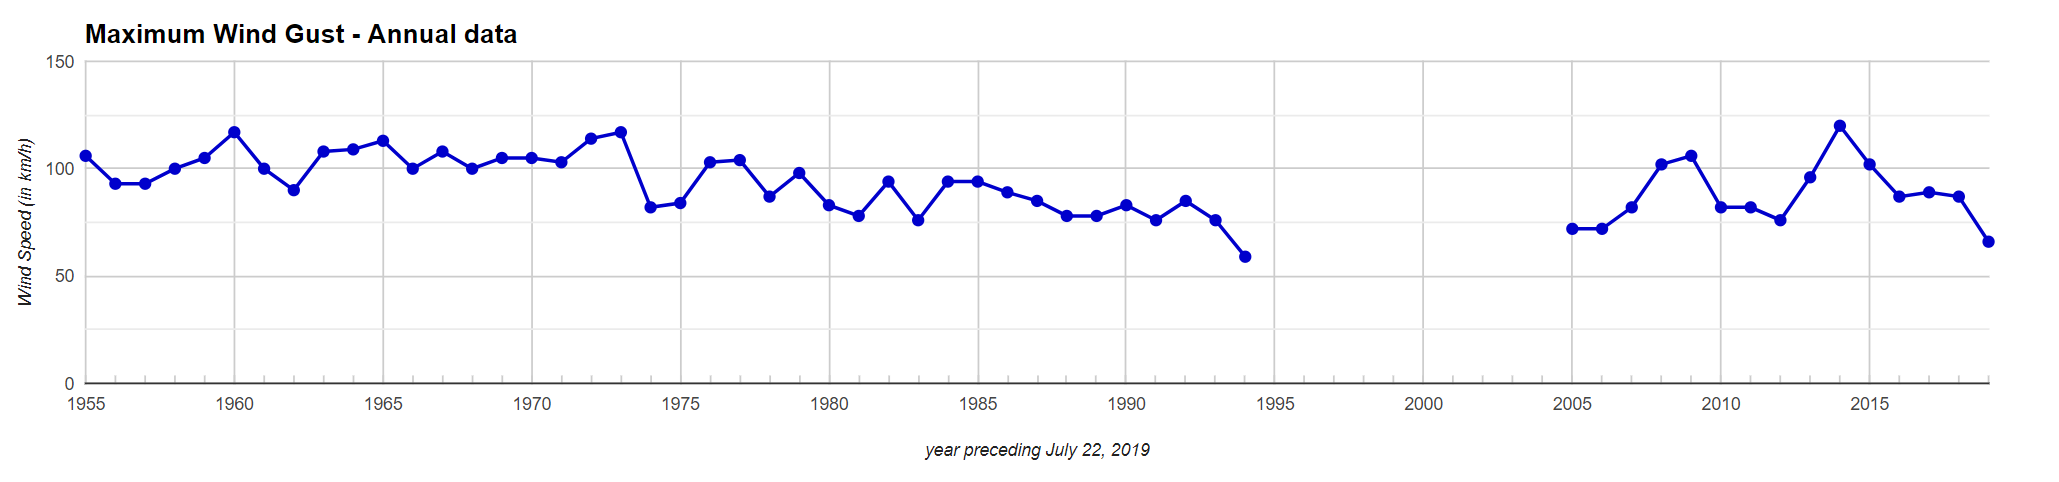
as are maximum gusts:
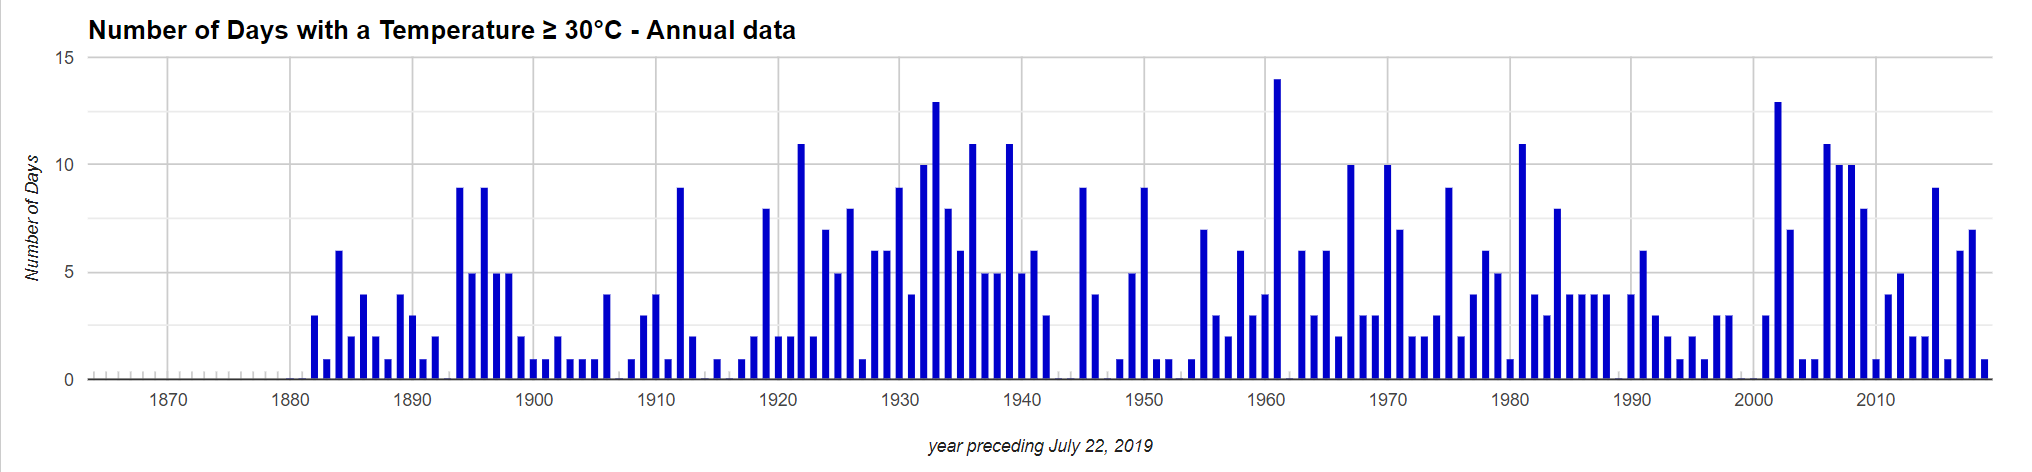
Heatwaves, measured as the number of days above 30C per year, peaked in 1961:
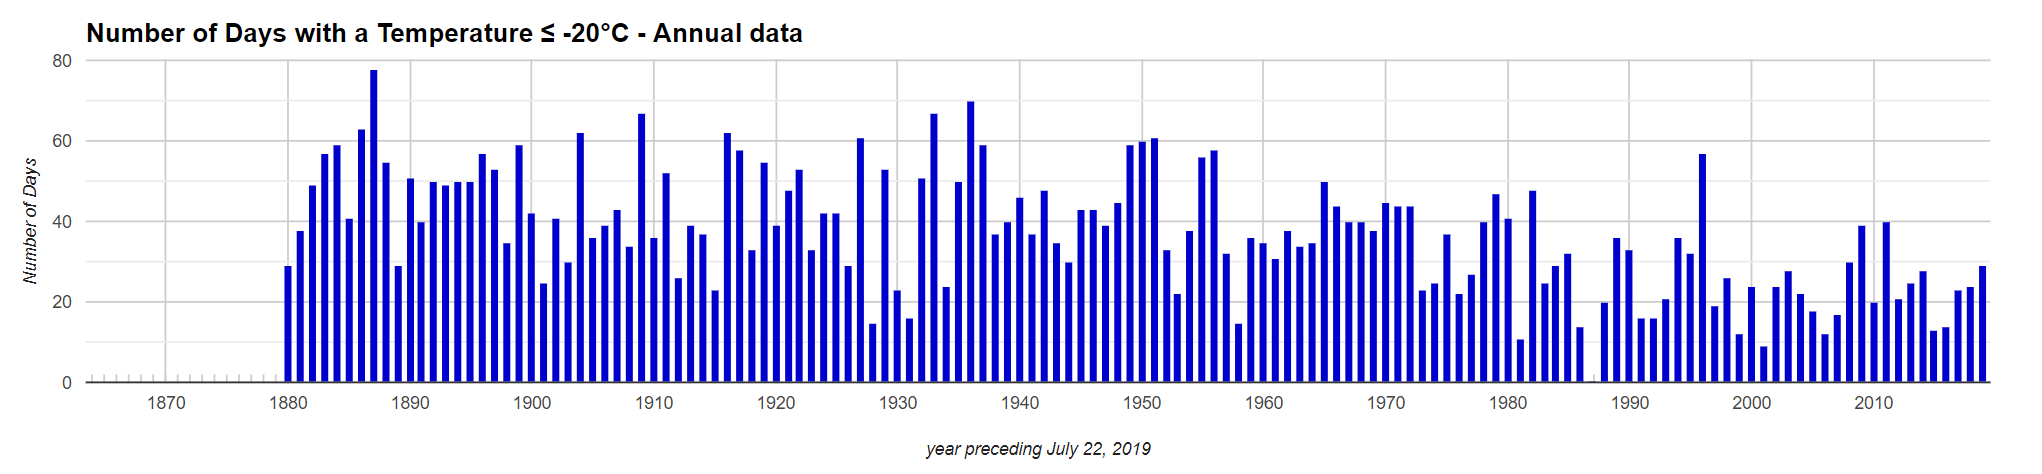
Cold spells, measured as the number of days below -20 C, have declined steadily to a minimum in 1987 before creeping up a bit since:
So if you lived in Edmonton over the past 140 years you would have found the coldest weather now a bit less cold, the average highs about the same, the precipitation about the same and the winds a bit milder on average. If that pattern strikes you as an emergency, you are probably not cut out for life on the prairies.


Your last sentence tells us that mayor and city counsel of Edmonton don't belong on the prairies.
And by reading their reason for declaring the climate emergency, after reading this article, you really wonder or
these people should be mayor and city counselors.
“This is a response to science first and foremost,” Mayor Don Iveson said. “I’m very comfortable in taking an evidence-based approach to this policy question".
How long will these fools keep denying the real facts? They turn their backs on ligament science to embrace the ridiculous in an attempt to create panic. Get your heads out of the sand and face the facts people!
CLIMATE CHANGE
Canada is the second largest country in the world with forest or other wooded land making up 40% of its 979 million hectares. Canada's forest cover represents 30% of the world's forest and 9% of the world's overall forest cover
In 2017, an estimate of approximately 573 million metric tons of carbon dioxide were emitted here. With a share of around 1.7 percent in global CO2 emissions, Canada is one of the ten largest emitters of carbon dioxide worldwide.
Around 80% of Canada's boreal forest is still relatively intact and free of ... On average, boreal forests store twice as much carbon per acre as tropical forests.
979,000,000 HECTARES = 2419161684.56 ACRES
2419161684.56 X 80 / 100 X10 TONS PER YEAR. = 19,353,293,476,48
2419161684.56 X 20 / 100 X 5 TONS PER YEAR = 2,419,161,684.56
SHOULD GIVE CANADAS TOTAL CO2 STORAGE PER YEAR.
TONS OF CARBON PER YEAR.
573,000,000 IN METRIC TONS OR 631,624,381.16 US TONS
SO REALITY ACCORDING TO MY MATH AND GOVERNMENTS OWN INFORMATION IS THE FOLLOWING.
SO WE ACTUALLY ABSORB 35 TIMES MORE CARBON THAN WE PRODUCE THIS DOES NOT INCLUDE PLANT LIFE. AND
At 0.02% of its forested area, deforestation in Canada is among the world’s lowest, yet many myths exist about the state of our forests. The reality is that Canada is a world leader in sustainable forest management. Canadian forests are healthy, productive and thriving.
WHAT CLIMATE CRISIS.....
Statistician Bjorn Lomborg had already pointed out that the Paris CO2 emission promises would cost $100 trillion dollars that no one has, and make only a 0.05 degree difference in Earth’s 2100 AD temperature. Others say perhaps a 0.2 degree C (0.3 degrees F) difference, and even that would hold only in the highly unlikely event that all parties actually kept their voluntary pledges.
What few realize, however, is that during the last Ice Age too little CO2 in the air almost eradicated mankind. That’s when much-colder water in oceans (that were 400 feet shallower than today) sucked most of the carbon dioxide from the air; half of North America, Europe and Asia were buried under mile-high glaciers that obliterated everything in their paths; and bitterly cold temperatures further retarded plant growth.
In fact, Earth’s atmosphere had only about 180 parts per million CO2, compared to today’s 400 ppm: 0.018% then versus 0.040% today
Carbon dioxide truly is “the gas of life.” The plants that feed us and wildlife can’t live without inhaling CO2, and then they exhale the oxygen that lets humans and animals keep breathing.
Our crop plants evolved about 400 million years ago, when CO2 in the atmosphere was about 5000 parts per million! Our evergreen trees and shrubs evolved about 360 million years ago, with CO2 levels at about 4,000 ppm. When our deciduous trees evolved about 160 million years ago, the CO2 level was about 2,200 ppm – still five times the current level.
current level.
There’s little danger to humans of too much CO2 in the air they breathe. Even the Environmental Protection Agency says 1000 ppm is the safe limit for lifetime human exposure. Space shuttle CO2 alarms are set at 5,000 ppm, and the alarm in nuclear submarines is set at 8,000 ppm!
Far more people die from “too cold” than from “too warm.”
The crops continue to produce record yields in our “unprecedented” warming – and the extra CO2 in our air is credited with as much as 15% of that yield gain!
The awkward truth, however, is that NASA has monitored moisture in the atmosphere since 1980 – and water vapor has not increased despite the higher levels of CO2 in the air. Is that why the IPCC models have predicted more than twice as much warming as we’ve actually seen?
The year 1936 recorded the hottest thermometer readings of any year in the last 5,000. However, these days NOAA reports only its “adjusted” temperatures, which always seem to go only higher. In fact, the first surge of human-emitted carbon dioxide after World War II should have produced the biggest surge of warming – if CO2 is the control factor. Instead temperatures went down from 1940 to 1975
https://www.eia.gov/tools/faqs/faq.php?id=307&t=11
The U.S. Energy Information Administration (EIA) estimates that in 2018, U.S. motor gasoline and diesel (distillate) fuel consumption in the U.S. transportation sector resulted in the emission of about 1,099 million metric tons (MMmt) of carbon dioxide (CO2) and 461 MMmt of CO2, respectively, for a total of 1,559 MMmt of CO2. This total was equal to 81% of total U.S. transportation sector CO2 emissions and equal to 30% of total U.S. energy-related
CO2 emissions in 2018.
cdiac.ess-dive.lbl.gov/trends/emis/tre_mex.html
Fossil-fuel carbon dioxide emissions from Mexico grew exponentially at a rate of 6.5% per year from 1891 to 1982. Since 1982, total fossil-fuel CO2emissions have slowly grown and now stand at 130 million metric tons of carbon.
THE MATH :
HOW MUCH CAN CANADA FORESTS ABSORB OF CARBON PER YEAR.
21, 772,455,161.04 TONS OF CARBON PER YEAR
PRODUCE: CANADA 631,624,381.16 US TONS
PRODUCE USA 3,637,700,000.00 US TONS
PRODUCE MEXICO 104,000,000 .00 US TONS
TOTAL ABSORBED BY CANADA ALONE. 21, 772,455,161.04
TOTAL; EMISSIONS ALL OF NORTH AMERICA 4,373,324,381,16
HOW IS THIS A ISSUE UNLESS YOUR MENTALLY DISTURBED.
https://greatclimatedebate.com/how-to-destroy-the-climate-change-hoax/