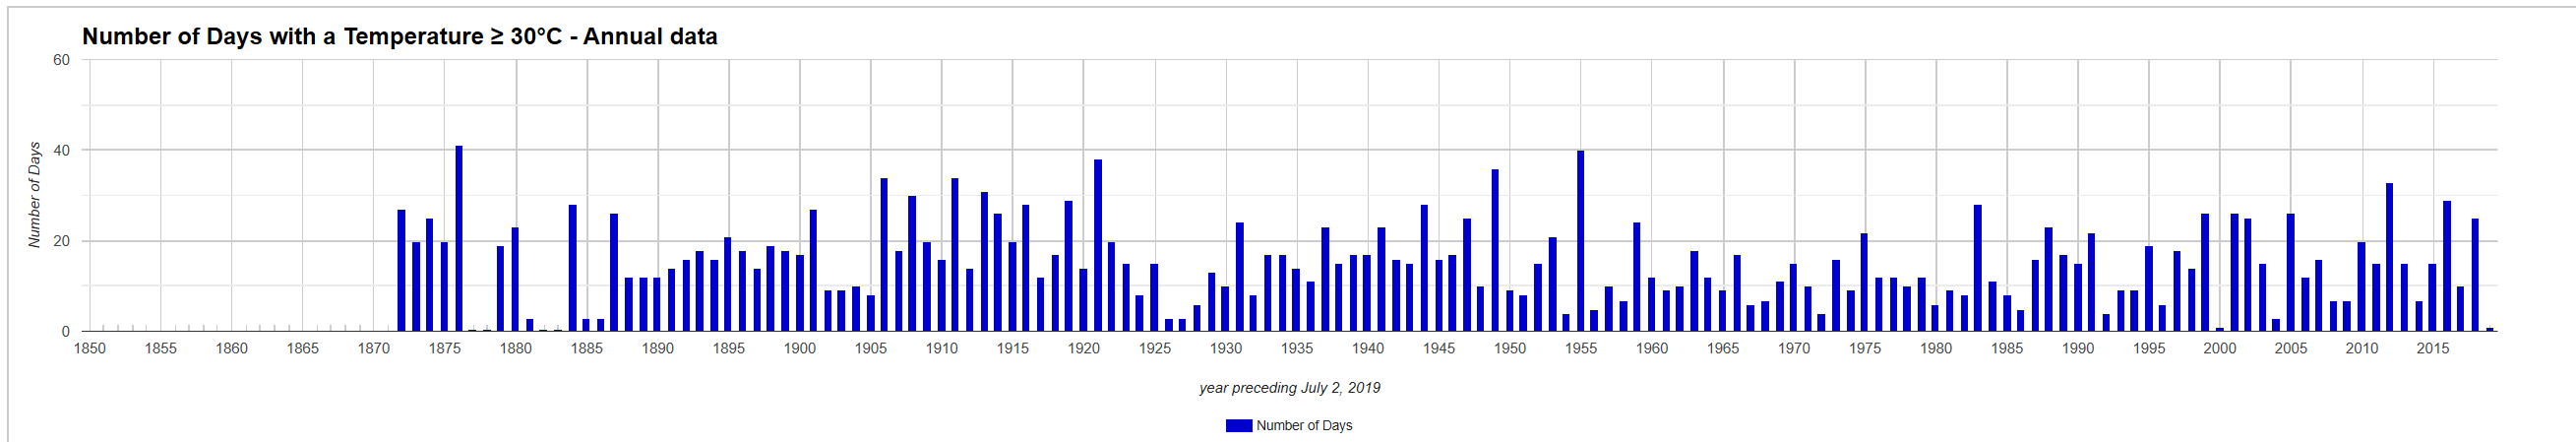
Via a CDN correspondent we recently learned of the remarkable website weatherstats.ca. It lets you see today's temperature across the country at a glance. But of far more interest to us are the long historical records easily accessible with a few clicks of the mouse. Up first: heat waves in Ottawa. We all know the Environment Minister believes they’re getting worse. But it happens that Environment Canada maintains a count of the number of days per year with temperatures above 30C going back to 1872. And the record shows...
Oh dear. This graph from weatherstats.ca shows a century and a half of Ottawa heat waves and it turns out Ottawa used to have more of them than it does now. Yet another myth busted.
 Here's how to find that graph.
- Go to https://www.weatherstats.ca/
- Zoom in to Ottawa and click the icon (you'll go here.)
- Click the Charts button at the top.
- Scroll down the list of weather indicators until you see Number of Days with a Temperature > 30 C.
- Select the 'go' link in the Annual Data column
- The graph that comes up will go back to 1994. On the line above it called Amount of Data to Show, click on 10x-Most.
Don’t stop there. Explore the data and send us your favourite graphs! Once you get the hang of it, you'll find it easy and fun to dig up all kinds of information you're not supposed to know. But you better do it quickly. Apropos of our related story this week about data tampering at the CRU, you just never know what the numbers will look like next month.


Funny isn't it, today Ottawa has a heat warning. 2019-07-03.
Interesting web site. Strangely Toronto’s temperature records only start in 1937. Maybe it is convenient to eliminate the dusty hot thirties.
Thanks for portraying this graph. Historical weather data is excellent to counter climate alarmists.