In our continuing series on Canadian cities enduring the horrors of the climate change emergency, today's stop is Calgary. Here we actually have a recent record-breaking stat: based on data back to the 1880s, the highest daily maximum occurred in 2018. But don't get too excited, the highest daily minimum was back in 1881, and the year with the most number of days over 30 degrees C was 1936. Rainfall hasn't changed in 70 years and maximum windspeed has been gradually declining since the 1970s. Not much of a crisis here.
Here's the weatherstats.ca temperature chart: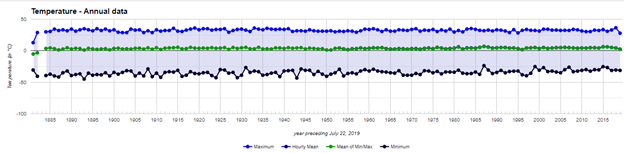
Heatwaves, measured as days per year with temperatures over 30 degrees C, were worse in the 1930s than any time since: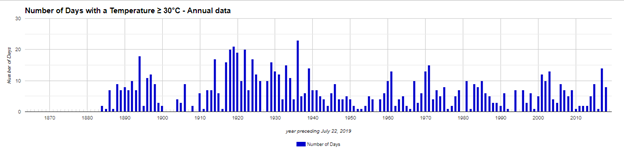
Mean wind speed hasn't changed in 70 years: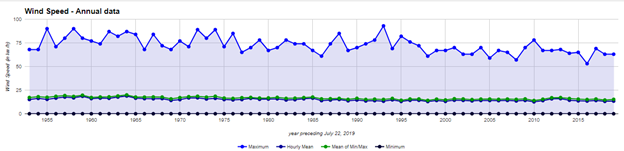
The chart of maximum wind gust shows a peak in 1976 and a minimum in 2003: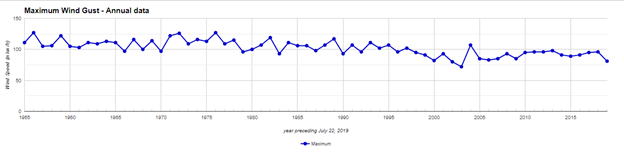
Total annual precipitation shows no trend: the peak was in 1902 and the minimum was in 1881: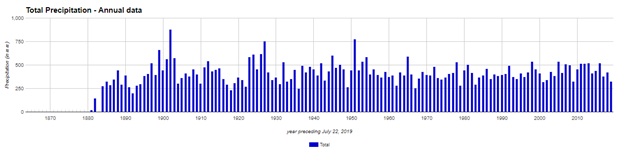
Wake us up when the emergency appears.


