In 2024 we profiled a bold study by University of Waterloo physicist Qing-Bin Lu who argued that CO2 is not the control knob on global temperature. Rather, he argued, we should be looking at halogenated Greenhouse Gases (halo-GHGs) like chlorofluorocarbons, the ozone-depleting gases controlled under the 1987 Montreal Protocol. Lu’s theory is that atmospheric temperatures are heavily influenced by a process called cosmic ray-driven electron reactions (hence it’s called the CRE model) that in turn are influenced by h-GHGs. So heavily influenced, he claims, that once its effects and theirs are taken account of, there is nothing left for CO2 to explain. The picture was obscured by the fact that, over the past few decades, changes in ozone and halo-GHG levels in the atmosphere would have caused temperature changes under the CRE model similar to those predicted by the CO2 model, so it wasn’t clear which model was correct. Also, the h-GHG theory wasn’t in vogue so there wasn’t much discussion or comparison…. until Lu came along. But since 2000, CO2 levels have been rising while halo-GHG levels were falling, and the predicted temperature changes diverged, making it possible to test the CRE and Enhanced CO2 Effect hypotheses against one another, and the facts. Now Professor Lu is out with updated data, and a book, and we are going to host him on an upcoming webinar soon to learn more about it. While it’s only two decades worth of data, some patterns are already becoming clear. Most notably and intriguingly, that Lu’s model is winning the real-world battle.
His most recent paper was published in AIP Advances, a journal of the American Institute of Physics, and his book appeared on March 7. He has also published recent papers on his CRE model in the Proceedings of the National Academy of Sciences, and while we’re not ones to assign credibility just based on a journal’s title, we mention it because he is getting his work into highly respected journals.
In order to do the comparison it’s important to recall that in a standard climate model, the rise in CO2 levels doesn’t cause uniform warming everywhere. On the contrary, it predicts different rates of warming in different places and also, in some, cooling. For instance it should warm the surface, especially in the polar regions, and the troposphere, the lowest layer of Earth’s atmosphere, especially over the tropics. But then the effect is meant to reverse in the stratosphere, which models project should be cooling. Except over the poles where models project continued warming up to the mid-stratosphere. Stratospheric cooling gets particularly intense over polar and non-polar regions alike as you go up to the upper stratosphere.
Which is fine. Nature and climate are complicated and there’s no “gotcha” in a prediction of some cooling way up on high as part of overall warming. The problem, for that theory, is that it’s not what seems to be happening.
Now the models do take some of the complexity into effect and again we do not say it as a criticism. Supposedly there are confounding effects in that ozone, halo-GHGs and aerosol all have impacts that may amplify or weaken the CO2 effect. So with ozone levels recovering and halo-GHGs levels declining, and aerosols also declining due to pollution reductions, the predictions get a bit hazy in places. Except over the poles and in the upper stratosphere.
There the models are very clear. And wrong. Lu presents a new set of satellite data comparing temperatures averaged over the 2013-2023 solar cycle minus those averaged over the 2002-2012 solar cycle. The result is graphed as follows, with height above the Earth’s surface on the vertical Y axis, south to north in degrees of latitude on the horizontal X axis, and temperature changes in colour as per the scale below the X axis:
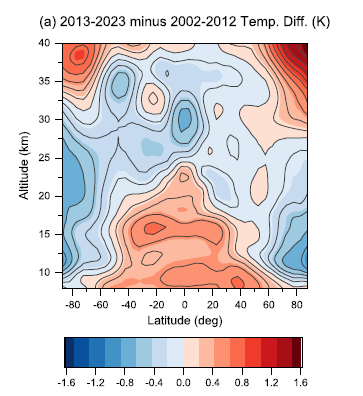
So the red triangle in the middle of the bottom half is warming in the lower stratosphere over the non-polar regions. Precisely where the models predict cooling. The deep blue up the left and right sides, to around 32.5 km near the South Pole and 27.5 near the North, is stratospheric cooling over the polar regions. Precisely where the models predict warming. And the red bands across the top show upper stratospheric warming. Precisely where the models predict cooling.
Intriguing. Even if Lu’s theory turns out to be wrong, it’s less wrong than its dominant competitor, the CO2 orthodoxy.
For more testing opportunities, Lu also notes that his CRE model predicts an end to warming and sea ice loss at the surface at both poles. And, again contrary to models, the Antarctic has been cooling slightly for decades, while the Arctic started cooling about 10 years ago.
Finally, Lu’s CRE model does a good job of explaining warming up to now, with no need for him to fiddle with arbitrary parameters, based on a model in which CO2 plays no role. And he projects we are turning around (assuming no more intense El Niño events) and will be on a cooling trend by 2030 as the effect of halo-GHGs declines in the coming decades. Rising CO2 levels won’t change that, according to Lu.
Lu has made a clear challenge to the CO2 model the way science is meant to work. Not with smears, cancellations and loss of government funding and posts at state universities, but with predictions that will be either right or wrong. And he’s absolutely not playing the usual #Haveitbothways climate game of making vague or opposite predictions so no matter what happens you get to claim you were right.
He makes his predictions clearly and boldly and throws down the gauntlet:
“Future observations will decide whether these predictions are true and which warming mechanism prevails.”
And we will be watching carefully to see. What about them?


." Even if Lu’s theory turns out to be wrong, it’s less wrong than its dominant competitor, the CO2 orthodoxy. " it was a good week for articles at the website except for this one that could have been written by bozo the climate science clown
... top of the atmosphere solar TSI has declined slightly since the late 1970s meaning it caused none of the global warming since the late 1970s ... CO2 does nothing articles are becoming increasingly popular among conservatives and that's why conservatives do not get taken seriously in the subject of climate science
Increasingly you say! Well, thanks for letting us know Richard. We know how terrible those cons are.