As we head into hurricane season, be prepared for the climate alarmists who, when a cyclone inevitably hits, will have you believe such things have never happened before, or never before in such numbers. Which is not to say that this year will be below average; after all the definition of an average is that one out of two years will be above average, on average. So how many normally hit? It depends where you look and what time of year you look. And where can you #lookitup? At the Colorado State University Real Time Tropical Cyclone tracker.
The data are shown in a simple tabular format like this:
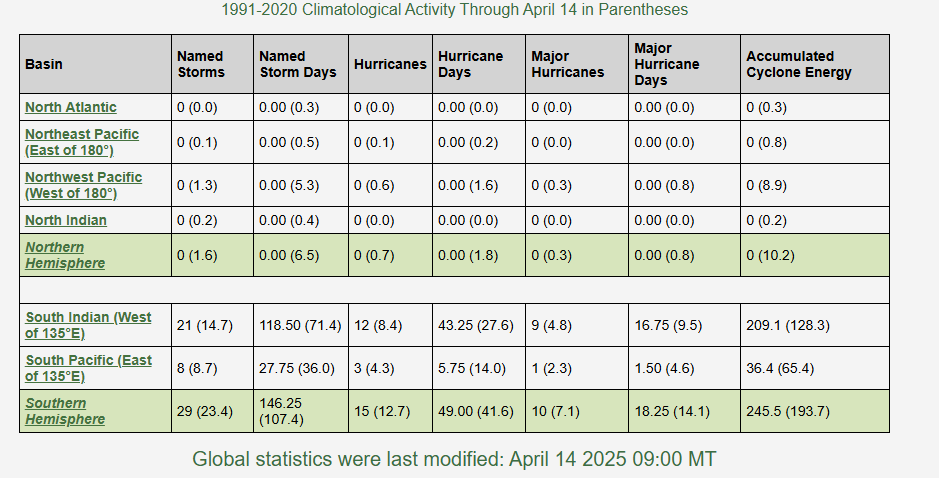
There are five hurricane basins, three in the Northern Hemisphere (NH) and two in the Southern Hemisphere (SH). The first column reports on the number of Named Storms from January 1 to the present day in the indicated basin (for the SH basins the number shown is for the 2024/25 hurricane season since theirs is now ending). And in that column the first number is the count and the second, in parentheses, is the expected number up to this point in the season based on the average over 1991-2020.
So in the Northeast Pacific (row 2) there have been 0.00 hurricane days, a bit below the expected average of 0.2 hurricane days. The final column shows the Accumulated Cyclone Energy index which integrates all hurricane activity into one overall measure. So far in 2025 every NH basin is tracking a bit below average whereas in the SH two of the three basins ended up above average.
The numbers are updated daily, so as we get closer to the late summer when hurricanes typically hit in the Atlantic basin, if you want to know how busy the hurricane season is relative to expected numbers, don’t listen to the hype. Go to the Colorado State University website and #LookItUp.


"Which is not to say that this year will be below average; after all the definition of an average is that one out of two years will be above average, on average."
Well...not exactly. What you're calling "average" is properly called "median". Consider the following data: 1,1,2,4. Obviously the AVERAGE is 8/4=2. The MEDIAN is the 50th percentile, somewhere between 1 and 2, by convention 1.5. Random sampling from this data produces 1 half the time and 2-or-more the other half. I.e., one out of every two times the sampled point will be above [alternatively, below] the MEDIAN, which is what you want. Only 1 out of 4 times will the sampled point be above AVERAGE (to avoid ties, replace the 4 with, say, 12). Which is why the median is often a preferred metric. But I bet you already knew that.