We recently reported on the IPCC’s new map-based Atlas showing compilations of research on historical trends in all manner of climate data, including measures of extreme weather. Since politicians and journalists rush to blame any wind-related events such as tornadoes and severe thunderstorms on climate change, we figured there must be an entry in the IPCC Atlas on this. And there is. Their map of the world shows that severe wind storms have been observed to be getting worse... nowhere.
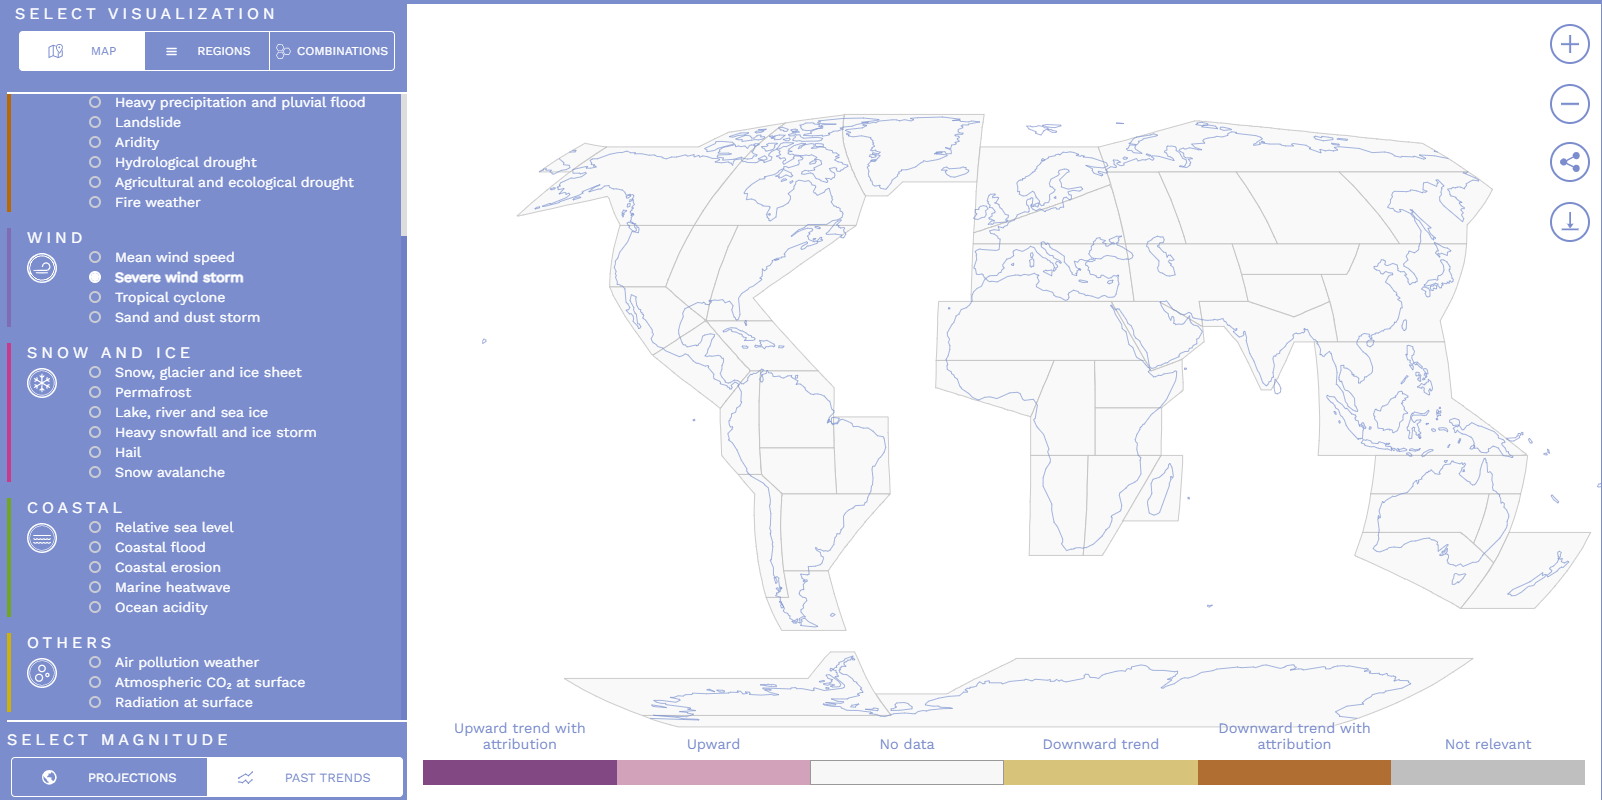
No, really. Here’s the map:

Where they have evidence of an increasing trend the map would be coloured pink or purple and where they have evidence of a decreasing trend it would be coloured yellow or orange, and where they have no data or no evidence of a trend the map is uncoloured. As you can see, the map is uncoloured, not just in a few places, but everywhere around the world. And notwithstanding the tendency of models to over-hype disasters, their map of future projections shows most places aren’t expected to change either.
Another climate myth blown away.


