
We now reach Section 4 of Dr. John Clauser’s lengthy new paper on the fallacies of climate alarmism, in which he turns his focus to the Earth Energy Imbalance concept, which he defines as “the net global power-flow imbalance, specifically defined as the net energy-flow-rate imbalance at the top of the Earth’s atmosphere.” And now for some acronyms… necessarily. Shortwave (SW) energy, visible light and above it ultraviolet, comes in from the sun and the Earth sends it back to space in two forms: reflected SW energy and thermal or longwave (LW) radiation that results when SW is absorbed, heats whatever absorbed it, and that heat comes back out as infrared. The power flow can be summarized by three numbers: SW coming in (SWIN), SW going out (SWOUT) and LW going out (LWOUT). Between them they add up to the entire net energy flow. So if SWOUT plus LWOUT equal to SWIN there is no net energy inflow and no global warming. (If they exceed it there’s cooling, and if it exceeds them there’s warming.) It is that simple, in Clauser’s view. What isn’t simple is how to measure these things, and more importantly, how to deal with the giant uncertainties in all the available measurements. Because the alleged imbalance or net inflow, the supposed cause of the climate crisis, is smaller than one part in 340, or about 0.2 percent of total flow either way. Meaning if the “error bars”, that is, the uncertainties in the various measurements, are bigger than 0.2 of the particular measurement in question, then there’s no proof of global warming not because there’s proof of something else but because there’s just uncertainty. And to jump ahead a bit, Clauser will point to the strange trick that different groups keep coming up with very different estimates of each component part of the total energy flow, but they always add up to the same 0.2 percent imbalance. He refers to that number as the BAD PENNY (caps in original) that keeps turning up. Actually he uses a lot of other, worse words for what is going on, which we’ll get to in due course. But he’s right that this penny is no good.
The energy imbalance concept is pretty simple in Clauser’s paper, as long as you skip the complicated parts. He presents a picture of a sphere with energy inflows and outflows, which is more or less what the Earth and its atmosphere comprise. Alas, once again playing the specialist who forgets he’s addressing generalists, he casually refers to “the continuity equation (a consequence of Gauss’s divergence theorem from vector analysis)” and the power flow through a “Gaussian surface” as if readers will know what he means. But the terms soon disappear so it doesn’t matter if you don’t understand them. All you need are the three energy flow numbers. If there is a net inflow of energy into the sphere, it has to warm up. If there’s net outflow it has to cool down. If there’s no net flow either way, it stays the same. So global warming comes down to the net inflow: Earth’s Energy Imbalance or EEI. (Alarmists always assume the imbalance must be positive, BTW.)
OK. But how do we know? Well, the flow rates are ideally measured at the top of the atmosphere since it’s the edge of the sphere we inhabit and we’re interested in what’s crossing that boundary in each direction. Clauser presents a 1987 diagram by physicist Veerabhadran Ramanathan providing an early estimate of the flows and looking exactly as if it were done pre-PC:
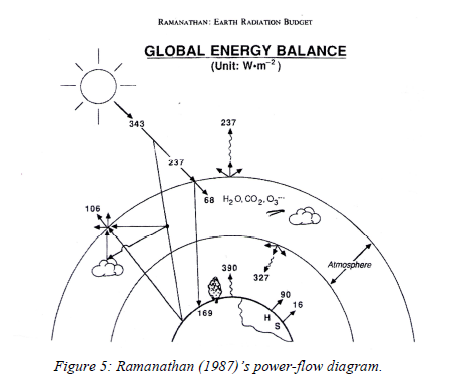
The numbers inside the sphere, energy going into and emerging from various things inside the outer atmosphere, add up to the numbers at the top of the atmosphere, which therefore are the ones that matter. Incoming solar energy (SWIN) is 343 Watts per square meter (W/m2). Reflected SW radiation (SWOUT) is 106 W/m2. Emitted thermal radiation (LWOUT) is 237 W/m2. 343 - 106 - 237 = 0. And according to the specific values in this diagram there is no net inflow (or outflow), no EEI and no global warming (or cooling). But soon other authors put forward slightly different numbers, all of course showing net inflow.
In the most recent IPCC report they said it was 340 W/m2 incoming (SWIN), 100 SWOUT and 239 LWOUT, all subject to uncertainty. 340 - 100 - 239 = 1 W/m2 net incoming, although in their detailed tabulations they said it was only 0.7 W/m2. So even if we take those numbers at face value, 0.7/340 is only 0.2 percent. The alleged EEI is minuscule, yet it is what is supposedly driving the climate crisis.
But Clauser doesn’t take the numbers at face value, because they’re not just miniscule relative to the whole system, they’re also crucially miniscule relative to the uncertainty. For one thing even the IPCC admits there are uncertainties around each component of the flow that make for much larger error bars than 0.7 W/m2. But worse, we simply don’t have measurement systems capable of tracking the flows with enough precision to confirm the EEI. Clauser will allege that the scientists working on the problem have resorted to data fudging, ignoring uncertainties and in some cases simply making stuff up to preserve a tiny EEI. We will start wading through his evidence next week.


As I read this it occurs to me that my teen age daughters would have suggested that these alleged scientists get a life!
Apparently, math skills are not a requirement to become a
climate scientist?!