
A few years ago we ran an “Everybody Knows“ series going over all the mistaken climate clichés that journalists glibly state without checking because they figure everybody knows, at least everyone they know, so it must be true. We can now add to the list the claim that extreme temperatures in the US are getting worse and worse. According to a new study by University of Alabama climatologist Dr. John Christy, while extreme heat episodes have risen since the 1960s, over the whole of the past 126 years, measures of both extreme heat and extreme cold have declined in the US. The American climate is getting less extreme not more.
Christy focuses on summertime daily maximum and wintertime daily minimum temperatures. He begins by noting that the weather data system known as the US Historical Climate Network (USHCN) has fallen into disrepair with almost half the sites not being updated to the present. Christy therefore had to search out local weather records for hundreds of locations around the country and manually update the USHCN archive to the present. He also found long stretches of blank USHCN entries in regions across the country, forcing him to dig out handwritten records and complete the dataset. (One of the by-products of all this sleuthing was the correction of the Death Valley temperature record that we reported on here.)
Armed with the longest complete set of daily US temperature records ever assembled, Christy then turned to examining trends in hot and cold extremes. He started by looking at year-by-year measures of all-time hot and cold weather records. The following chart shows the total number of daily hot (Tmax) and cold (Tmin) temperature records by year. There are 153 days in the May-September season and 122 days in the December-March season. The chart is computed by looking at each of the 153 hot days (May 1, May 2, ... September 30) and asking in which year did the US set all-time hottest or coldest record for that date? Here’s how it looks by year:
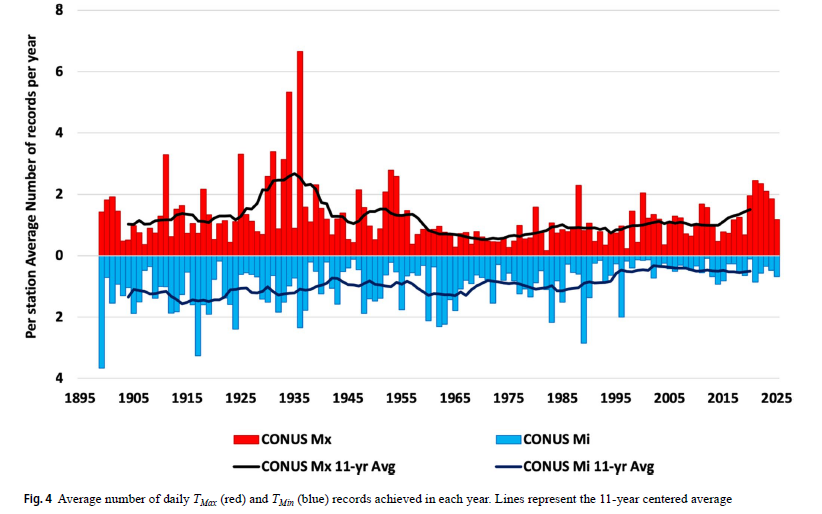
Weird, huh? If the climate were simply warming steadily over time, most of the all-time warmth records would be in the final years of the sample. But the largest numbers were in the 1930s and 1940s. While the last few years have set some records, the period from 1920 to 1950 stands out as the era with the most extreme heat. (As, we must observe, the US raw temperature data record would suggest unlike the “adjusted” one to make the recent past the hottest ever due to man-made GHGs as “everyone knows” it was.)
The cold weather record is different, though. While 1899 was a very cold year and many records were set, since then there have been steadily fewer and fewer extreme cold records. So if hot isn’t getting hotter, it does seem that cold is getting warmer. But there’s more.
Christy then isolated the extreme days and looked at how the annual hottest day at each weather station compared to the long term average of its hottest days. Because again, if the climate was pushing heat extremes higher and higher, this measure would be trending up. Instead it looks like this chart:
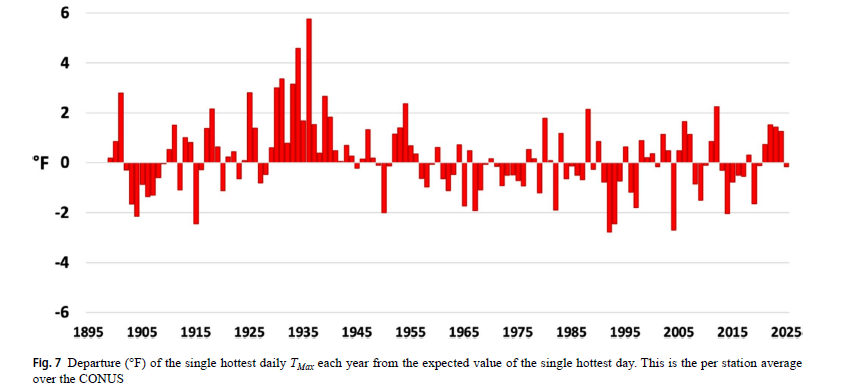
Once again the 1930s and 40s stand out: when they experienced hot weather it tended to be even hotter than today’s extreme heat days. By contrast, as Christy shows, winter cold days are somewhat less freezing cold than they used to be. Putting the two together means, once again, that the US climate is getting less extreme.
Christy then goes into some detail about how various groups have analyzed historical temperature extremes, modified data to account for changes in measuring methods and generally pushed a message of rising extreme heat. He focuses particularly on the last National Climate Assessment (NCA5) that declared heat extremes (days above 95°F) were getting worse and worse, but only showed data back to 1960. Referring to the complete data record, Christy notes:
“[There] is no increase in the occurrence of 95 °F (35 C) days within the CONUS [continental US], and in fact, the CONUS has experienced an 8.3% decline since 1899. None of the past 10-year totals are in the top ten values. The NCA5 acknowledges the decline for the central and eastern parts of the CONUS (see their Fig. 2) yet ascribes this decline to an apparently untestable cause, ‘summer cooling trends.’ To be consistent, the NCA5 could also report that the rise in western CONUS extreme temperatures is due to ‘summer warming trends’.”
Ouch. Christy concludes:
“The extreme heat in the pre-1940s era provides a measure of the magnitude that natural variability exerts on the heat-extreme climate of the CONUS. Such eras increase the statistical magnitude of natural variability making it difficult to attribute recent events to a specific cause, realizing that natural variability is always present in any climate situation. The overall picture from results such as seen in Figs. 5, 6, 7, 8, 9 and 10 is that the heat extremes occurring in the CONUS today are well-within the range that natural variability already provides.”
Yes, heat waves happen, and yes, extreme cold weather also happens. It always has. And despite what the alarmists claim, these extremes are not getting worse in the US, instead when viewed over the entire 20th and 21st centuries they have been getting less extreme over time.
P.S. It is well-established that if highs are not getting higher but lows are, you’re probably looking at an Urban Heat Island distorting the record.


Daytime highs are no higher than they were 125 years ago, but overnight lows have increased, accounting for all of the average temperature increase over that time period. With a smaller change in the temperature from daytime to nighttime, the weather is more habitable, and with fewer frosty nights, the growing season is longer, which has resulted in more vegetation. That increase in vegetation has been verified by NASA satellites. Of course some of that increase in biomass is attributed to the increase in CO2. But CO2 has a cooling effect during the day because with increased biomass, a photon from the sun is more likely to hit a leaf or a blade of grass, converting that photon into sugar and cellulose, rather than hitting the earth and warming it. What’s not to like about that?