Last summer’s “red team” climate report from the US Department of Energy began its review of extreme weather by showing an 850 year record of Nile River depth levels observed at Roda Island in Cairo. This famous data series shows considerable variability, not just from year to year but over century scales. And because it ends in the 15th century the variations are entirely natural unless you want to blame global warming on thundering hosts of chariots. But given the variability, it would be surprisingly easy to pick a 100-year segment of the record and assume there was an alarming trend up or down. On which basis they caution generally that trends over short intervals can be deceptive, and then illustrate the point by showing readers specific numbers from all kinds of datasets from all kinds of places. This week we focus on the hurricane record particularly.
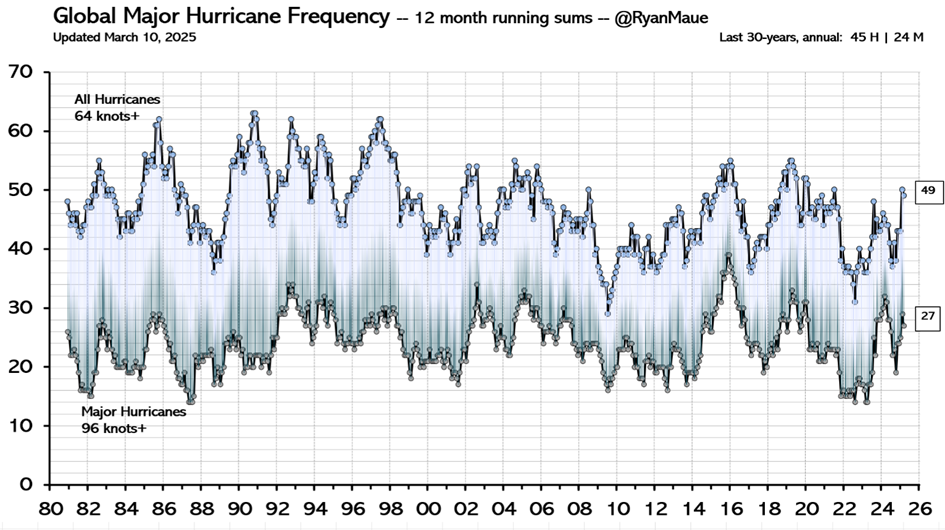
The DoE team begin with Ryan Maue’s global hurricane frequency record from 1980 to the present:
They supplement it with data on North Atlantic hurriane activity from 1920 to the present:
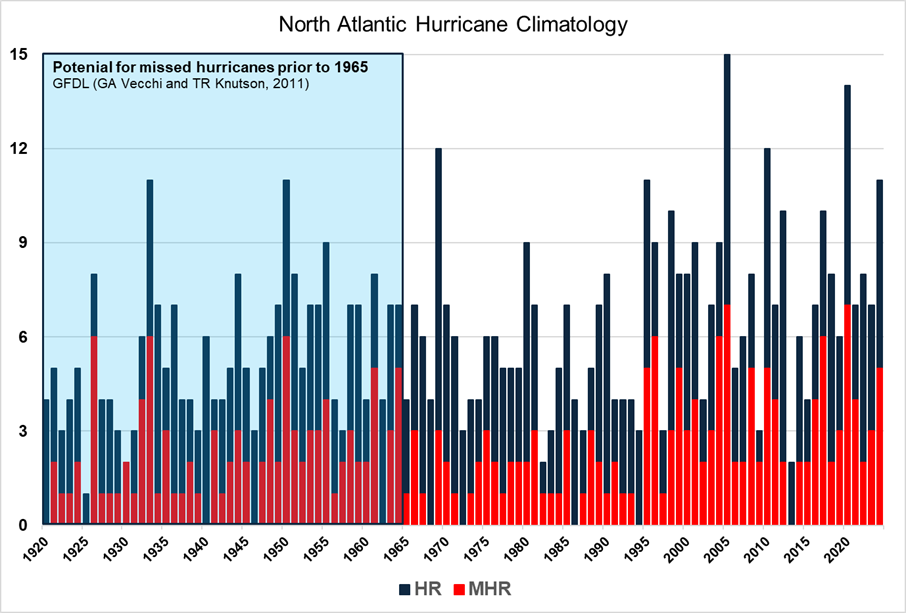
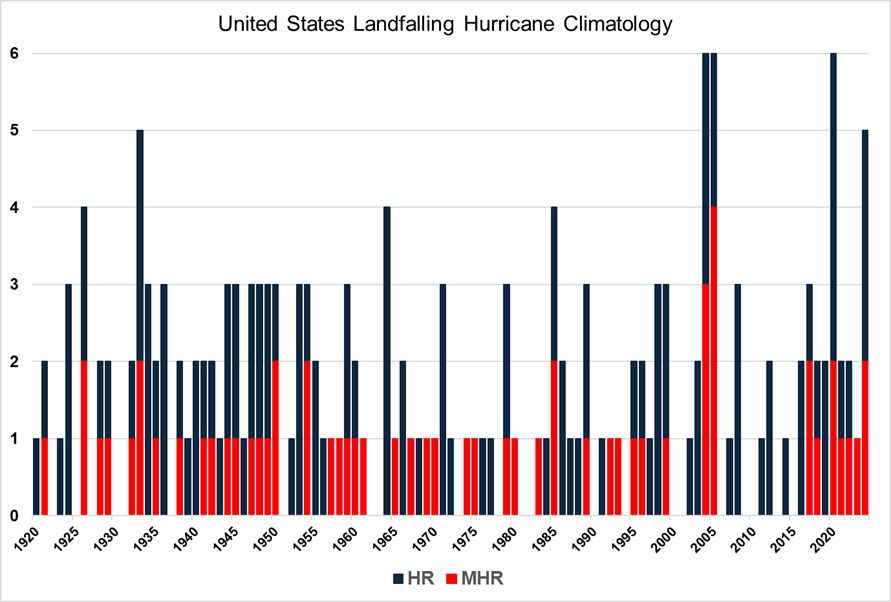
“HR” denotes hurricanes and “MHR” denotes major hurricanes (Category 3 and above). The shaded box refers to an interval during which small hurricanes were likely undercounted. Then they show the record of US landfalling hurricanes since 1920 which has a few high recent years but no trend overall:
They observe:
“Villarini et al. (2012) provide an analysis of U.S. hurricane landfalls back to 1878. While it is possible that some landfalls were missed in the late 19th century owing to sparsely populated regions on the Gulf Coast, it is remarkable that the highest year in the entire record is 1886, with 7 hurricane landfalls, when human influences on the climate were much smaller than they are today.”
Overall, they conclude:
“The relatively short historical record of hurricane activity, and the even shorter record from the satellite era, is not sufficient to assess whether recent hurricane activity is unusual relative to the background natural variability. Atlantic hurricane processes are influenced substantially by the natural modes of ocean circulation variability in the Atlantic, notably the Atlantic Multidecadal Oscillation. While it has long been hypothesized that a rising global sea surface temperature would cause an increase in hurricane intensity, identification of any significant trend in the hurricane data is hampered by a short data record and substantial natural variability.”
So anyone hollering that we have unmistakable trends toward more hurricanes, stronger or both either hasn’t looked at the data, didn’t understand it, or didn’t care.
Next week: are temperatures getting more extreme?


I still predict hurricane numbers to go down with a warmer planet. Hurricanes seem to occur mostly when the temperature gradient from north to south is stronger. Since the warming basically broadens the tropical zone around the equator, with more warming towards the poles (the actual Antarctic seems to be an exception possibly because it's so isolated), this reduces the temperature gradients over the globe. At the very least this should result in hurricanes forming more towards the poles and since the northern hemisphere is mostly land towards the poles, where hurricanes don't really like to form at all, this reduction should be strongest in the north, while in the south it may be much less.