Last week we looked at the lack of a warming hotspot in the tropical troposphere, or global troposphere for that matter, a crucial point where model predictions fail so obviously that even the IPCC concedes it, while conveniently burying it deep in the back pages. The DoE team went on to point out that the mismatch goes further than just predicting too much warming. Climate models embed a feedback process by which warming increases with altitude through the troposphere up to a height of about 16 km, and predict an especially strong amplification of surface warming between 8 and 12 km up. So as we look up layer by layer there should be a steady increase in the warming trends, if greenhouse gases are doing what the models expect to the atmosphere and the planet. To illustrate the point the IPCC drew a diagram showing what the models say the warming pattern should look like, compared to the vertical pattern if GHGs have no effect. They also plotted what the data show. And remarkably the mere real-world observations match the models with no GHG effect and don’t match the standard model runs. So how did the IPCC hide this result? Veeery carefully.
The DoE team described what the IPCC did in the 5th Assessment Report as follows:
“The comparison was in AR5 Chapter 10, although only in the online supplement (Figure 10.SM.1) and only in a figure whose formatting obscured the point. Figure 10.SM.1 is not referenced in the main IPCC report nor in any summary so readers would not have been aware of it. Although not apparent at first glance, it shows that the 1979-2010 warming in the lower troposphere is so small as to be consistent with no GHG forcing at all and is inconsistent with the model runs that do have GHG forcing.”
Here is the Figure, annotated by the DoE team to draw out the meaning:
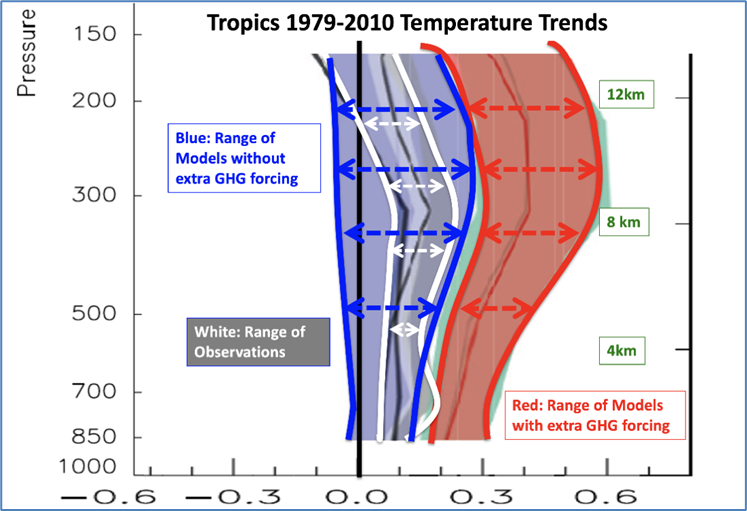
The horizontal axis shows the temperature trend in degrees C per decade. The vertical axis shows the altitude using air pressure on the left axis and km on the right. The blue lines show the range of results from models run with no GHG forcing. Unsurprisingly, the warming is close to zero and doesn’t get amplified much with altitude. The red area shows the warming rates in models forced with historical GHG rates. Again unsurprisingly, the warming is between 0.2 and 0.3 degrees C per decade near the surface and goes up from there until you reach about 12km above ground level. Between 8 and 12 km up the warming rates are between 0.3 and 0.6 degrees C per decade, then go down as you approach the top of the troposphere.
Now here’s the surprise, or maybe not to CDN readers. The observations are shown with the white lines and it’s immediately apparent that the observed (white) warming falls in the blue (no GHG forcing) range and outside the red (climate orthodoxy) range. So the observed warming does match model outputs… but only when the dreaded GHGs are left out.
The DoE team show a similar figure from a journal article and discuss the way in which model defenders have tried unsuccessfully to argue that the models are basically right despite being wrong, due to a lot of uncertainty we don’t hear much about in other contexts. But uncertainty can’t cover this particular multitude of sins.
The atmosphere’s temperature profile is a case where models are not merely uncertain. They show a dogmatic common warming bias relative to observations. This result shows that they prefer doctrine to observation. And it also suggests that their internal processes misrepresent certain fundamental feedback processes. (Or don’t actually attempt to represent them because of the scale problem we have discussed elsewhere in this series, but contain workarounds that misrepresent their results.)
It’s too big to ignore. But it’s also too awkward to discuss. So the IPCC put in a chart showing the problem, but only in an online Appendix, not in the main report, and didn’t mention it in the body of the report so readers would have no way of knowing what to look for. And as for what the IPCC had to say in its most recent report, the AR6, the DoE team simply pointed out:
“The IPCC AR6 did not assess this issue.”
The DoE Report goes on to examine a few other important differences between models and observations which we’ll review next week. It too won’t be a pretty picture.


“The IPCC AR6 did not assess this issue.”
Probably because an assessment that finds your primary claims to be so highly exaggerated as to be clearly disputable is not conducive to receiving more funding….
More evidence that the radiative GHG effect does not exist. Hats off to Nikolov and Zeller who show in various papers how then GHG effect violates the 1st & 2nd Laws of thermodynamics.
Didn't understand - "... an especially strong amplification of surface warming between 8 and 12 km up...". Either "surface warming" or "8 and 12 km up" (or both I suppose).
Lapse rate feedback has been proven. It is a conservative myth that this does not exist. This week's batch of articles is the least accurate in the many years I have read this website.
Lapse rate feedback describes how changes in the vertical temperature gradient of the atmosphere modify the greenhouse effect in response to warming. Evidence for its existence and its dual nature (negative in the tropics, positive at the poles) comes from a combination of theoretical physics, climate modeling, and satellite observations.
Key Evidence and Proofs
Observational Confirmation:
Satellite & Sounding Data: Researchers use atmospheric soundings and NASA CERES satellite measurements to observe vertical warming patterns. In the tropics, these observations show that the upper troposphere warms faster than the surface, confirming the negative lapse rate feedback.
Arctic Warming Observations: Detailed observations of the Arctic boundary layer confirm that surface-concentrated warming occurs during winter when sea ice retreats, providing empirical evidence for the positive feedback in high latitudes.
Modeling Experiments (Feedback Suppression):
Locked Lapse Rate Simulations: Scientists "prove" the impact of this feedback by running climate models twice—once with the lapse rate allowed to change and once where it is "locked" or suppressed. These experiments show that the lapse rate feedback is responsible for approximately 15% of Arctic amplification and 20% of Antarctic amplification.
CMIP Ensemble Studies: Large-scale model intercomparisons (like CMIP6) consistently show a strong correlation between nonuniform vertical warming and total global temperature change.
Theoretical Physics (Energy Balance):
Radiative Kernels: The feedback is quantified using radiative kernels, which measure the change in top-of-atmosphere (TOA) radiation per unit of temperature change at different altitudes.
\Moist Adiabatic Constraints: In the tropics, the "proof" is tied to the laws of thermodynamics; as the surface warms, increased moisture and convection force the atmosphere toward a moist adiabatic lapse rate, naturally resulting in more warming aloft and efficient cooling to space.