As noted elsewhere this week, Matthew Wielicki has posted an update on the very quiet 2025 hurricane season in which he makes reference to a website we ourselves have recommended, namely the Colorado State University Real Time Tropical Cyclone Tracker. Selecting the North Atlantic region opens a chart of Accumulated Cyclone Energy (ACE) to date, comparing the observed level to the long term regional average. ACE is, as the name implies, an index not merely of the number of named storms but of their total energy, thus creating an index of the overall severity of the storm season. Bearing in mind that 2025 was forecast to be an above-average storm season, it is remarkable to see the ACE index is now only half the level expected for a normal year at this point.
The chart looks like this:
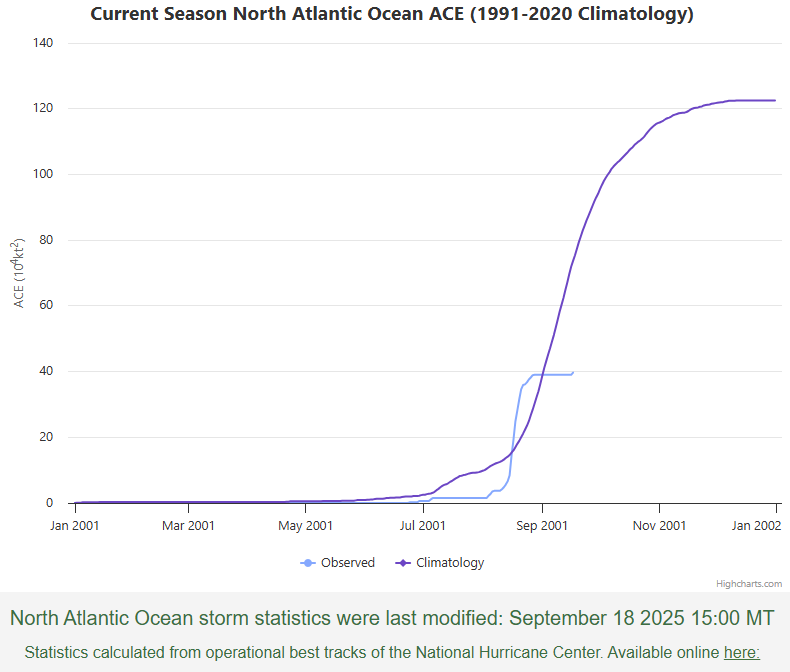
The solid black or on many monitors purple line shows the expected ACE in the North Atlantic basin over the hurricane season based on 1991-2020 data. It is measured in units of 10,000 squared knots. The blue line shows the observed accumulation so far this season. After a slow start it jumped in mid August from about 5 to about 40 where it has flatlined since. As of Sep 20 its expected value is 79.4 while its observed value is just over 42. So roughly half of what it normally would be, and even further behind what it had been forecast to be.
As we often point out, if the discrepancy had gone the other way, you’d have heard all about it by now, under headlines shrieking WORSE THAN WE THOUGHT!!!!


