Last week we told you about a surprisingly blunt critique of the IPCC’s unsurprising attempts to hide the uncertainties in past climate reconstructions. This week we look at a fascinating paper by Scottish and German geoscientists led by David Kemp with the arguably less than gripping title “Maximum rates of climate change are systematically underestimated in the geological record”. Kemp et al start by noting that people are concerned about contemporary rates of climate change and want to compare it to past episodes of change. When we look far back in time we can see evidence of big swings in temperature, but they cover such long intervals that when they are averaged to changes per decade or per year the rates seem very small compared to today’s. But, the authors ask, what if the types of proxies used naturally smooth out the record, so that even if there had been short periods of rapid change we would probably not be able to see them? And, digging deeper, if so, would there at least be clues in the data to that problem if not to what it’s obscuring? The authors argue that the answer is yes and that, moreover, the clues in question actually do indicate that we have been overlooking evidence of past rapid climate fluctuations.
All proxies are imperfect and they tend to become more so the further back in time. For instance some, particularly geological ones like rock formations, span enormous time periods but only contain a few data points meaning they can only ever suggest relatively smooth transitions. (If you have three readings over 10 million years, for instance.) And there are some proxies that record higher frequency information, annual in the case of tree rings, for instance, but which in addition to other potential problems span much shorter times since a very long-lived tree such as a bristlecone pine may just reach 5,000 years but certainly not 10 thousand let alone 10 million.
Given this issue, the authors gathered a large group of different proxies together and plotted the rate of change against the time span covered by each record. They found a sharply downward-sloping relationship between how long a period the proxy covered and how rapid a rate of change it suggested, as per this chart:
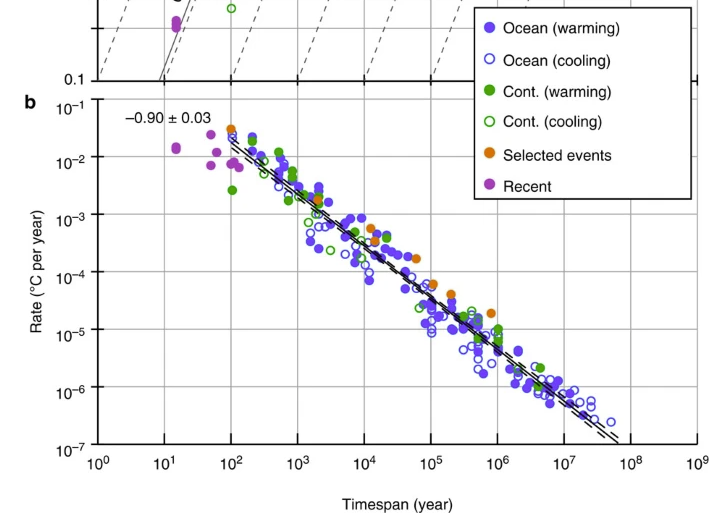
This graph indicates that the longer the time span covered by the record (horizontal axis), the lower the warming rate it implies (vertical axis). Yet the actual rate of warming isn’t different in each case, especially since the different proxies in question cover overlapping periods. The authors conclude that when using long time-span proxies there may have been episodes of rapid warming, and cooling, on short time scales that are simply not being picked up:
“Our findings indicate that the true attainable pace of climate change on timescales of greatest societal relevance is underestimated in geological archives.... episodes of climatic or evolutionary change likely fail to capture the true pace of changes on timescales of most relevance for understanding the impact of similar changes today. Implicitly, our findings also mean that caution must be exercised when describing recent temperature changes as unprecedented in the context of geological rates.”
This finding means there is nothing in the evidential record to deny that there were plenty of warming events at rates that equal or exceed the present in the geological past, and that there is plenty to suggest that sharp short-term trends tell us nothing about longer-range ones taking place simultaneously:
“Warming across the Permian-Triassic boundary stands out as the most significant temperature change of the past ∼0.5 billion years... The abundance of accompanying evidence for biotic crises and other palaeoenvironmental changes during these extreme events emphasizes how transient stasis and reversals in long-term temperature trends do not preclude the reality of large-scale climate change with lasting environmental impact, either in the geological past or today.”
This finding matters because alarmists don’t just like to describe recent temperatures as the “warmest ever” despite the millions of years of obviously warmer conditions in the geological past. They also like to describe recent warming as the “fastest ever”. What this new data analysis shows is that there may well have been periods of even faster warming and cooling in the past that were hidden by the long timescales of the available evidence, and that our methods of estimating past temperature changes over long periods would certainly not detect them directly if they did exist.
It’s a note of scientific humility we welcome, and commend.


Thus, we have Disraeli's admonition that there are lies, damned lies and then statistics. Being a marketing professional for a good portion of my career...prior to retirement....I used statistics on a daily basis, As the saying goes, the devil is in the details. This chart is VERY interesting to me because in general, longer time periods garner more data points and lead to accuracy, but in this case, the opposite is true, one heck of a big devil in that particular detail!
The graph is TOO GOOD. It just shows the results that can be achieved when a bunch of proxy seeking curve fitters are looking at other published proxies to verify their results….and making their numbers match so that peer reviewed publication and resultant career enhancement can occur.
Is this a 'new' paper? When I looked I got 2015 as the publication year.