Continuing our dive down into Ole Humlum’s Climate4You.com data collection, this week we get our heads up into the clouds and our metaphor in a knot to learn about clouds and water vapour. As you know, and everyone should know, water vapour is the most powerful greenhouse gas by far, much stronger than carbon dioxide. One reason is its absorption of infrared radiation. But another is that the formation of clouds from water vapour, and their subsequent behaviour, has strong effects on the Earth’s climate. Evaporation of water cools the planet’s surface, while its condensation further up into the liquid droplets we see as clouds releases heat and warms the troposphere. Moreover cloud tops are reflective surfaces, keeping some sunlight from reaching and heating the surface, though the effect varies by location and type of cloud. So the amount and nature of cloud cover has a very large influence on temperatures. And what has been happening to cloud cover over the past few decades? Funny you should ask.
It has been trending downwards, as shown by this chart from Humlum:

The reduction in cloud cover over the past two decades explains some, and perhaps all, the warming of recent decades, which again necessarily requires us to reduce the amount of warming attributable to other factors including CO2 and so to dial back our estimate of how powerfully CO2 causes warming. But what caused the diminishing cloud cover?
Good question. And the answer, despite all the yapping about “settled science”, is that no one knows. The issue has attracted the attention of climate scientists and those of us who keep track of these sorts of things (see here and here for examples).
We know the result of the decreased cloudiness has been that more sunlight reaches the Earth’s surface and causes warming and it also explains some of the observed melting of the Greenland ice cap. But we don’t know why it happened so put that in your model and don’t smoke it.
Another interesting droplet of data concerns atmospheric humidity. Since water vapour is a strong greenhouse gas, if warming induced by carbon dioxide causes the amount of water vapour (humidity) in the atmosphere to rise (as climate models assume) it would amplify the CO2-induced warming. Indeed without it the models cannot generate scary warming from CO2’s direct effect alone.
The amount of vapour in the air is measured using the concept of relative humidity: the amount of water vapour in the air relative to the maximum amount it could hold at current temperatures. As temperatures rise, the models’ crucial water vapour amplification requires that relative humidity should remain constant or increase. Alas it ain’t so in the real world. Instead, while relative humidity is pretty constant near the surface, above the surface it is trending down.
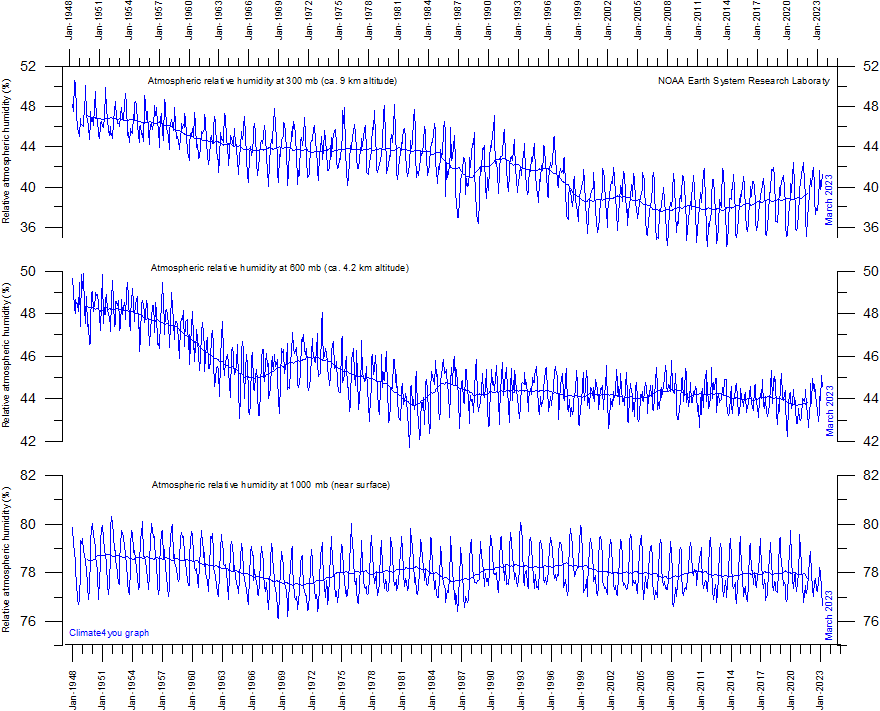
It seems the atmosphere is better at keeping its cool than we usually give it credit for.


And the answer is…..starting around 1985…..new mass produced digital electronic weather modules used in weather balloons used more and more until 100% in-use about 1996.
This single fact, water vapor evaporating from the surface results in cooling is the temperature regulation process which maintains relatively stable temperatures regardless of other factors. You can see this temperature stability clearly by going to a place with no surface water like the Sahara Desert, very hot during the day and freezing cold at night because there is very little water evaporating during the day and there is no water vapor in the air to hold in heat at night. The moon is another excellent example, temperatures fluctuate wildly between sunlight and dark, no atmosphere means no water vapor ergo no temperature regulation!