Note: this post has been edited to correct an earlier version.
Continuing with our fact check on Al Gore’s epic rant in Davos, this week we turn to his claim that, referring to CO2 emissions, “That’s what’s boiling the oceans.” Boiling, you see. Or don’t. Using the worldwide network of Argo buoys, we can now see the different ocean warming rates by depth layer.
From our friends at Climate4you.com here are the monthly temperature records by ocean layer for each year from 2004 to 2020:
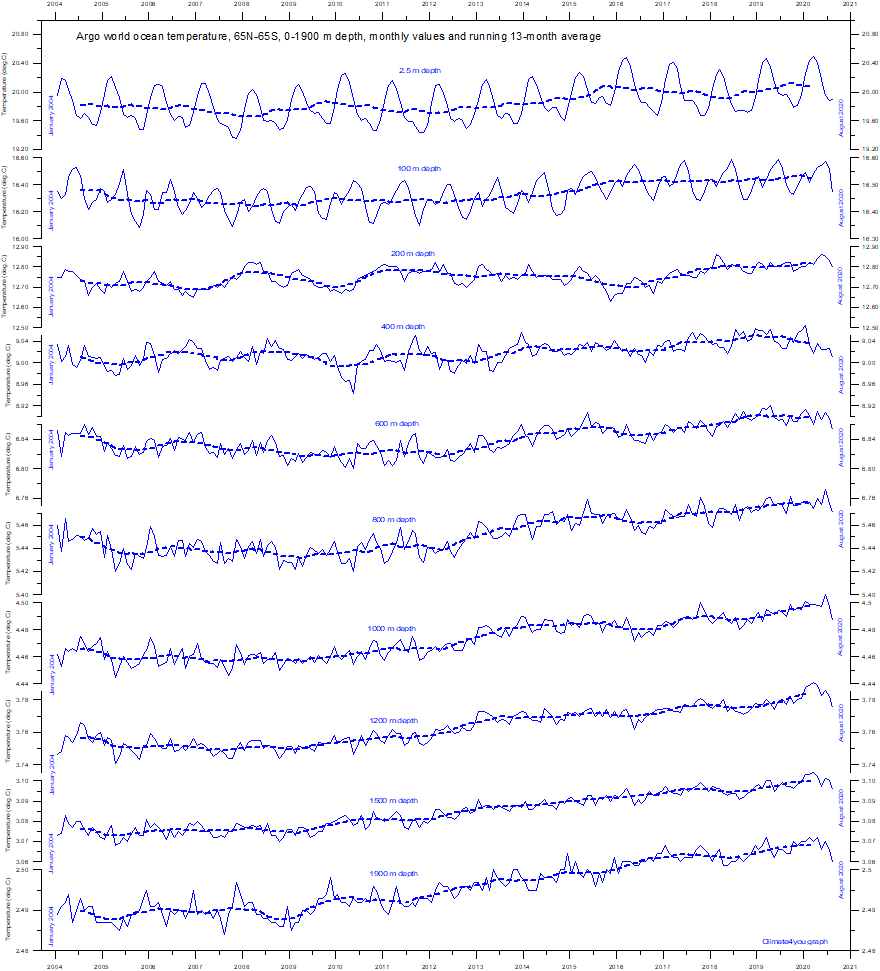
Because the scale changes it's hard to compare the warming rates by depth so we got the underlying data and worked out the trends (in degrees C by decade) at every depth: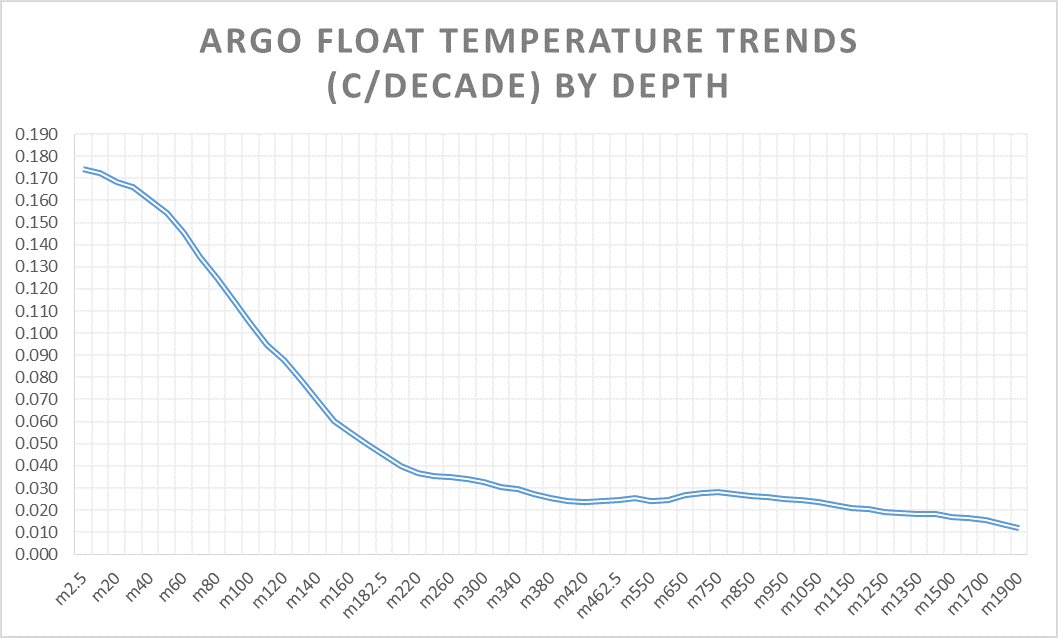
The topmost layer warmed at a rate of about 0.17°C per decade from 2004 to the end of 2019 (the last complete year in the sample). Then the warming rate drops off quickly as you go down so that below 200 meters if the present trend were to continue it would amount to less than half a degree C per century.
Meanwhile the current Sea Surface Temperatures range from 0°C near the poles to about 30°C near the tropics. So, no, the oceans aren’t above 100°C and “boiling” nor would it even be possible for them to do so. Nor, apparently, is it possible to expect logic, data or rhetorical restraint from Mr. Gore.


Surface warming at about .1 deg/decade. Steeper appearing gradient at depth due to scale choice so cannot draw conclusions from that about source of heat.
Aaargghhh! Ocean currents move around in gyres and plunge into the depths and resurface in different places depending on surface winds, continental runoff, chaotic behaviour, and overturn on the time scale of weeks to centuries. A graph like that shown is as meaningless and useless to humanity as a graph of the average depth of snow over North America….simply a mathematical construct calculated from randomly located measurement stations for which there is no reason for consistency.
Well spotted. I wonder why they wouldn’t keep a constant range. Can be around a different midpoint but similar ranges would help comparisons. The bottom curves will look flat and weakens the theory postulated.
Yes, thanks for pointing it out and sorry we missed it initially. The post has been corrected.