From the CO2Science Archive: Perhaps no other climatic variable receives more attention in the debate over CO2-induced global warming than temperature. Its forecasted change over time in response to rising atmospheric CO2 concentrations is the typical measure by which climate models are compared. It is also the standard by which the climate model projections tend to be judged; right or wrong, the correctness of global warming theory is most often adjudicated by comparing model projections of temperature against real-world measurements. And in such comparisons, it is critical to have a proper baseline of good data; but that is easier acknowledged than accomplished, as multiple problems and potential inaccuracies have been identified in even the best of temperature datasets. One particular issue in this regard is the urban heat island effect, a phenomenon by which urban structures artificially warm background air temperatures above what they normally would be in a non-urbanized environment. Working with temperature records in and around the metropolitan area of Athens, Greece, Founda et al. set out to examine the interdecadal variability of the urban heat island (UHI) effect, since “few studies focus on the temporal variability of UHI intensity over long periods.” Yet, as they note, “knowledge of the temporal variability and trends of UHI intensity is very important in climate change studies, since [the] urban effect has an additive effect on long term air temperature trends.”
Paper reviewed: Founda, D., Pierros, F., Petrakis, M. and Zerefos, C. 2015. Interdecadal variations and trends of the Urban Heat Island in Athens (Greece) and its response to heat waves. Atmospheric Research 161-162: 1-13.
The urban influence on a given station’s temperature record can be quite profound. In large cities, for example, urban-induced heating can be as great as 10°C or more, making it all the more difficult to detect and discern a CO2-induced global warming signal in the temperature record, especially since the putative warming of non-urbanized areas of the planet over the past century is believed to be less than 1°C. Yet, because nearly all long-term temperature records have been obtained from sensors located in towns and cities that have experienced significant growth over the past century, it is extremely important that urbanization-induced warming -- which can be a full order of magnitude greater than the background trend being sought -- be removed from the original temperature records when attempting to accurately assess the true warming (or cooling!) of the natural non-urban environment. A new study by Founda et al. (2015), however, suggests this may not be so simple or straightforward a task.
To complete their objective the four Greek researchers compared long-term air temperature data from two urban, two suburban and two rural stations over the period 1970-2004. The UHI was calculated as the difference between the urban and surburban (or rural) stations for monthly, seasonal and annual means of air temperature (max, min, and mean).
Among their several findings, the authors report notable differences in the UHI’s intensity across the seasons and in comparing the UHI when calculated using maximum, minimum, or mean temperatures. Of significance to the discussion at hand, however, the authors note “the warming rate of the air temperature in Athens is particularly large during [the] last decades,” such that the “difference of the annual mean air temperature between urban and rural stations exhibited a progressively statistically significant increase over the studied period.” Indeed, as shown in the figure below for the stations (a) National Observatory of Athens (NOA) in the center of Athens and Tanagra (TAN), approximately 50 km north of the city, as well as for (b) the coastal urban station of Hellinikon (HEL) and again the rural station of Tanagra, the anthropogenic influence of urbanization on temperatures at these two urban stations is growing in magnitude with time such that “the mean values of UHI magnitude [calculated across the entire record] are not quite representative of the more recent period.”
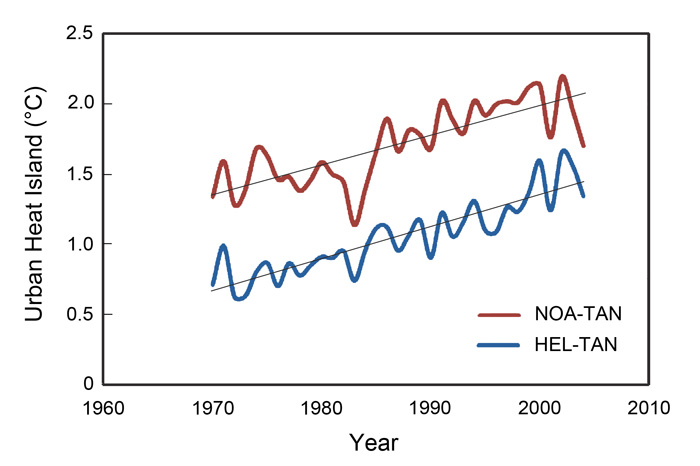
Interdecadal variation and annual trends of the Athens, Greece UHI calculated between two urban and one rural station using mean annual temperatures over the period 1970-2004. The two urban stations were the National Observatory of Athens (NOA) in the center of Athens and Hellinikon (HEL), located near the urbanized coast. The rural station Tanagra (TAN), was located approximately 50 km north of the city. Adapted from Founda et al. (2015).
Such findings as these are of significant relevance in climate change studies, for they clearly indicate the UHI influence on a temperature record is not static. It changes over time and is likely inducing an ever-increasing warming bias on the temperature record, a bias that will only increase as the world’s population continues to urbanize in the years and decades ahead. Consequently, unless researchers routinely identify and remove this growing UHI influence from the various temperature data bases used in global change studies, there will likely be a progressive overestimation of the influence of the radiative effects of rising CO2 on the temperature record.


It's obvious: all those urban heat temperatures are caused by all that extra CO2 insulating the population with their nasty petrol cars and their gas central heating. That's why global warming thermometers are sited in urban areas to prove it.
Michael Michael I would imagine if as you say the extra CO2 causes the temperature difference then the difference in temperature would be rather constant. More than likely heat from the sun and environment is absorbed from by the concrete and steel and later released. If the data is available one could compare sunny vs cloudy days to the temperature difference to see if sunshine impacts the temperature difference.
Did they consider the other geographical influences on temperature? Proximity to a body of water would be just one such influence. To put the three observation sites in order of proximity to water, then Tanagra, in the middle of the county, would be least effected. Athens, inland but reasonably proximate, would be second, and Hellinikon, being a seaside town would be third.
The importance of geographical influences may be emphasized by looking at the climate at Portmeirion in Wales, UK.
Why would a climatologist ever use an urban temperature record? In theory you need only one pristine weather station because if there is a global trend that one station would detect it sooner or later. In practice that is being done by the USCRN (United States Climate Reference Network) consisting of 124 (I think) weather stations ideally situated and with the best equipment (including three thermometers so if one malfunctions they know which one). The network was established in 2005 and last time I checked it showed a small but insignificant decline in temperatures over the previous 16 years.
Cities keep growing upward decade by decade, with tall warm buildings blocking the view of cold outer space from the IR radiating from the ground that was warmed during the day.
This combined with ever more paved and concreted parking lots means that UHI constantly increases and is not the fixed number it was thought to be a decade ago.
Because of the obvious doubts about the temperature readings, which anyone of average intelligence would be able to deduce, it can be reasonable to think that this is the reason why the "warnings" were changed from "global warming" to "climate change.
Even now this is not scary enough, now we are increasingly hearing
" climate crisis ".
But for the control to keep working we have to keep instilling fear into the populace by upping the rhetoric.
What next I wonder?
I ask this slightly "tongue in cheek: but never get an answer (if it deserves one)
WHY IF urban centres such as London are on average more than 3c above the remainder of UK .not resulting in a mass exodus from London if an increase in temp of more than 1.5c is catastrophic??
Funny how increased temperatures in the North caused by the change in surface from white snow/ice to dark water/land is acknowledged as contributing to global warming but the same affect from UHI's is not.
In the 1998 James Hansen paper that had two graphs on the first page you can clearly see this. The left graph of continental USA temps showed the 1930s warmer than the late 90s. (Tip, if you go to the GISS site and graph the same variable mean temp 5 year average from 1880-2000 you now see 1998 much warmer than the 1930s. Imagine that)
But it’s the WORLD graph on the right that shows steady increasing temps. Of course most of the rest of the world only has records from cities and so it is an unvarnished record of UHI.
I think Roy Spencer showed that If you remove the UHI the USA has been cooling for decades.