From CO2Science: At present, the majority of studies investigating the response of marine organisms to ocean acidification do not account for natural fluctuations in pCO2 [which is related to acidity] although studies have shown this parameter can vary significantly over hours, days, weeks, seasons and other time scale. Instead, far too many keep experimental seawater pH constant, thereby introducing potentially significant errors in their assessments of the future impacts of ocean acidification on marine life. Recognizing this unfavorable situation, Hannan et al. (2020) note that “although we know that fluctuating pH/pCO2 can have different effects on marine organisms compared with stable exposures, data are still insufficient to properly parameterize experimental treatments for many nearshore and shallow water environments.” Consequently, they add, “documenting the temporal and spatial variability in pH/pCO2 that organisms must presently cope with is the first step to understand how organisms may respond to changes in the pH/pCO2 projected to occur in the future. And so it was that the six Australian scientists set out to improve this sad state of affairs by examining the daily variation of pH and pCO2 at three different microhabitats within three different reefs.
Paper reviewed: Hannan, K.D., Miller, G.M., Watson, S.-A., Rummer, J.L., Fabricius, K. and Munday, P.L. 2020. Diel pCO2 variation among coral reefs and microhabitats at Lizard Island, Great Barrier Reef. Coral Reefs, doi.org/10.1007/s00338-020-01973-z.
The three reefs, Trawler Reef, Big Vicki’s Reef and Palfrey Reef, were located in the lagoon off Lizard Island, a tropical island situated in the mid-shelf of the Northern Great Barrier Reef approximately 30 km off the Australian mainland. The three microhabitats within each reef from which data were collected included a hard coral, open substrate and soft coral site. Seawater pH and other physical measurements were made at each of these locations over a period of 9 days in the midst of the Austral winter of August 2014.
Plots of the daily variation in pH and pCO2 are shown in Figure 1. As illustrated there, the largest pH range was observed on Trawler Reef (ΔpH of 0.213, or 250 µatm pCO2), followed by Palfrey Reef (ΔpH of 0.205, or 223 µatm pCO2) and Big Vicki’s Reef (ΔpH of 0.100, or 116 µatm pCO2). Analyzed across all reefs, the greatest predictor of pH (or pCO2) variation was time of day and reef location, which together accounted for ~63% of the variation. The pH (pCO2) was the highest (lowest) during the daytime hours of 1230 to 1420 and lowest (highest) during the night (0230-0620), which diel pattern the authors say is “consistent with other work on the Great Barrier Reef and attributable to the drawdown of CO2 during the day from photosynthesis and CO2 release at night from respiration.” Microhabitat type, in contrast, exerted very little influence on reef pH or pCO2 levels.
Commenting on their findings Hannan et al. note that the diel range they observed for pH and pCO2 at the three reef sites is likely muted from what would have been observed had they performed their analysis in the summer. Under warmer temperatures the daily pCO2 and pH ranges would most certainly have been larger, driven by increased reef metabolism and calcification at the higher water temperatures. Nevertheless, the diel ranges they observed here are still quite impressive, leading Hannan et al. to caution that “studies on the physiological effects of ocean acidification on shallow nearshore organisms should try to include fluctuating treatments when drawing conclusions about the future impacts of ocean acidification.”
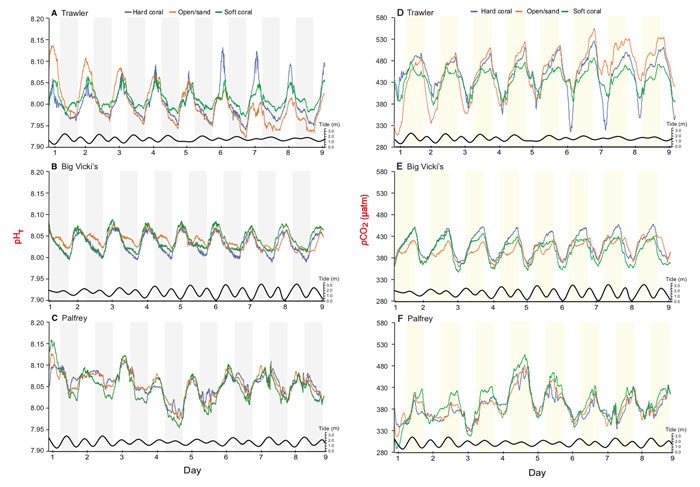
Figure 1. The variation of pHT (panels A, B and C) and pCO2 (panels D, E, and F) at three reef sites around the Lizard Island lagoon over the 9-day period in winter. Different microhabitats within each reef where data were collected are represented by different colors (hard coral = blue, soft coral = green, open substrate = orange). White bars represent day and shaded bars (grey or yellow) represent night. Tidal height is represented by the black line at the bottom of each graph. Source: Hannan et al. (2020).


I don't get the whole "ocean acidification" scare. The greatest explosion of life on earth took place during the Cambrian, when atmospheric CO2 was 16 times as high as today. This explosion was in the oceans, and mostly left behind fossils of shellfish (e.g. in the famous Burgess Shale). During the Cambrian when CO2 was around 7,000 ppm, the oceans were not a bubbling bath of acid - so why would anyone think that they are on the verge of becoming lifeless in our lifetimes, when CO2 is likely to get to only 500 ppm?
Ditto. Oceans have fairly robust buffering mechanisms against acidification. Excess carbon is slowly converted to limestone, or, if the warmists are correct and the earth does become warmer then dissolved gases become less soluble and are released into the atmosphere.
The cited study suggests that, so called, experts are only just starting to gain some understanding of ocean pH, etc.