One of the difficulties in studying 20th century climate is that some of the data sets we'd like to examine don't go back far enough, or don't have enough detail. To get around this data drought, scientists have devised a technique called reanalysis, which combines available data with weather modeling systems to interpolate and extend the data to cover the gaps. Models on their own aren't reliable enough to go back in time that far, but when anchored to the points in time and space where observations exist, they can do a decent job of filling in the blanks. And one of the big blanks is the ocean. Not long ago a team of European scientists completed a massive reanalysis project of ocean heat content. Not surprisingly they found the ocean has warmed in recent decades. But what came as a bigger surprise was that the ocean warmed a lot in the early 20th century, and the recent warming was little more than a recovery to the levels previously seen in the 1950s.
The reanalysis record shows a surprisingly variable record for ocean heat content over the past century.
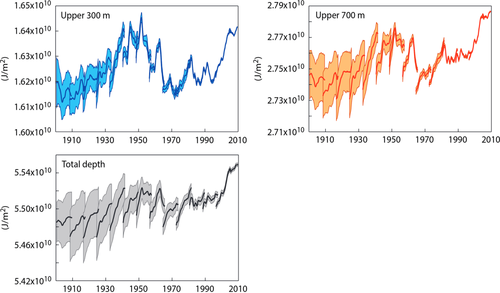 In the upper 300m the recent warming hasn't yet brought temperatures back to where they were in 1950. At deeper layers the warming has reached or exceeded the 1950 level. And while there is a gradual trend upward, the oceans showed no warming from 1950 to the mid-1990s, and the upper layer cooled noticeably, despite the increase in greenhouse gases.
Among the many ridiculous inconsistencies of the climate emergency movement is their failure to explain how today's climate can be in such a state of crisis if it's not so different from the state it was in decades earlier. Another is denying that it’s anything like the state it was in decades earlier.


If you think we have enough global measurements of ocean temperature at depth from 100 years ago to "re-analyse," I have some soon-to-be ocean-front property in Arizona for you to purchase. This is complete nonsense, even if it refutes the cAGW conjecture.
But, the graph mirrors all 'supposed' global temps. The rise from 1900 to mid 1940's. The drop to ~1978 (when the new Ice age was predicted) and the rise to the present. 70% of the atmospheric heat comes from the oceans. Interesting parallel.