A correspondent alerted us to an upcoming effort to get Markham to declare a climate emergency. It apparently not being enough that Toronto has already done so. But, always seeking for where the alleged emergency might be hiding, we decided to take a look. It's only common sense to suppose that a city declaring a climate emergency would be experiencing a climate that looks distressingly different than it did, say, 30 years ago, in the non-climate-emergency 1980s. But asking for common sense when it comes to the Climate Emergency movement is apparently too much.
The records for Markham only go back to the mid-1980s, but let's take a look. Temperatures are rocketing upw--, uh, not doing much of anything: 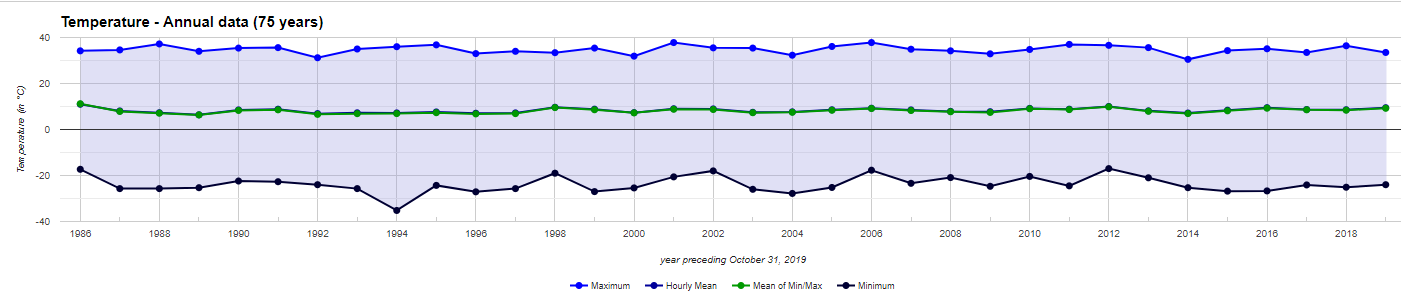
Mean temperatures hit a high in 1986 and a low in 1989. They've stayed in the same range ever since. Daytime highs hit a record high of 37.8 in 2006 but then hit a record low of only 30.5 in 2014. Et cetera. Temperatures over the last few years, for all practical purposes, were the same as they were three decades ago.
So was precipitation. 1992 was the high water mark, so to speak, and since then it's been up and down within the normal range: 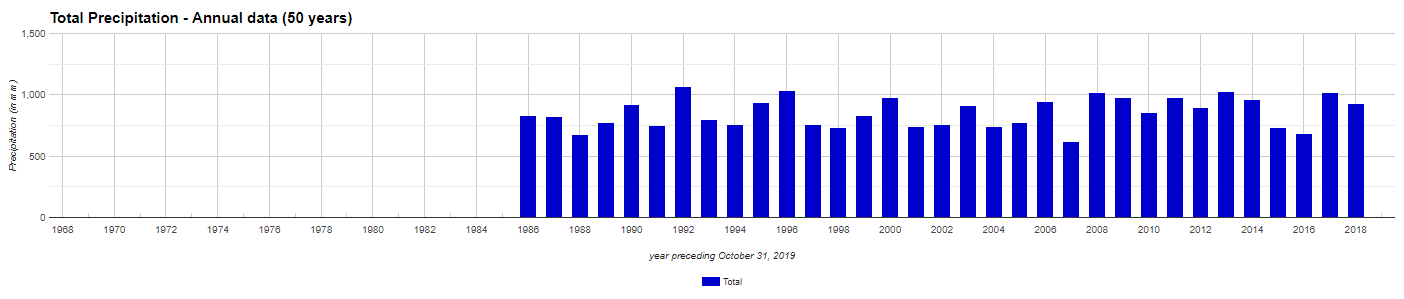
Wind speed, like many places in Canada, has gradually declined over the past few decades: 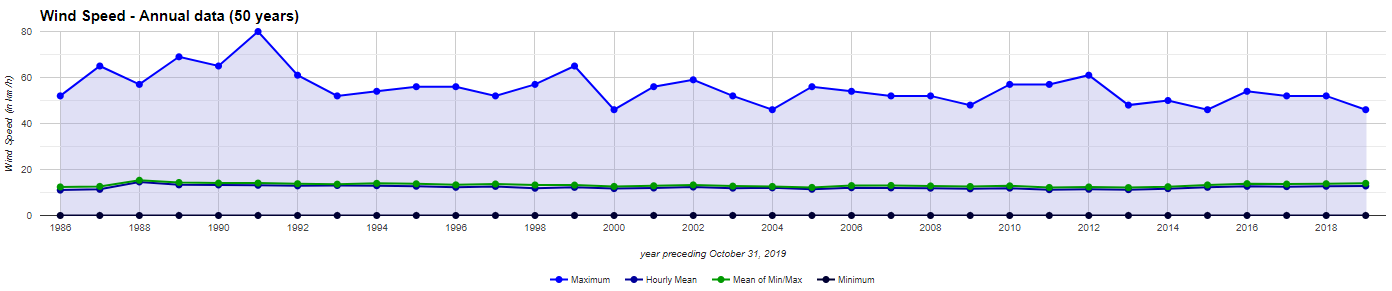
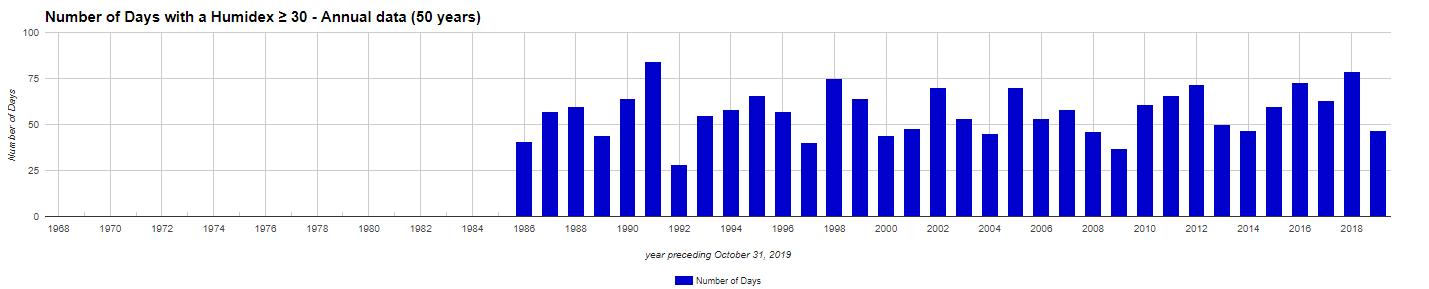
Heatwaves, measured as the number of days with a humidex over 30C, hit a peak back in 1991, and haven't done much since:
Meanwhile average relative humidity was at its highest back in 1986 and has gradually declined since: 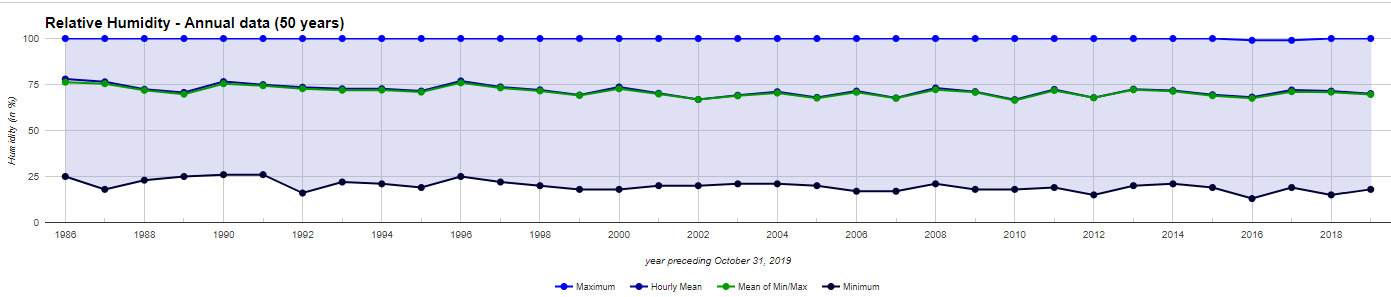
It's pretty hard to declare a climate emergency when the climate won't cooperate.


The compressed ordinate scale used on the weatherstats.ca data plots tends to disguise small trends. Plotting the raw data for mean annual temperature in Markham with a total y-axis range of about 5 degrees instead of 80 degrees as used in the plots, an upward trend becomes apparent and is on the order of about 0.7 degrees (eyeball regression only).
11 C in 1986 looks like an outlier, so I checked the Environment Canada data for Pearson International Airport for 1986, which reports a mean annual temperature for 1986 of 7.5 degrees C. Was Markham really 3.5 C warmer on average in 1986 than the Toronto airport? I doubt it. Since the Markham data starts in 1986, likely the data for that year is incomplete and that year should be excluded.
Whether the warming trend observed in Canadian cities is a climate emergency or not is a fair subject for debate as is whether or not it is predominately caused by our carbon dioxide emissions , but publishing data plots with a compressed scale so as to disguise small changes of a degree or less, and then to pretend they aren't there is bad journalism.