
In Al Gore’s now-infamous documentary An Inconvenient Truth he placed a lot of emphasis on a reconstruction of temperatures based on oxygen isotopes in ice cores, mainly collected in Chinese glaciers by Dr. Lonnie Thompson, which supposedly validated the Michael Mann hockey stick. Indeed, Gore dubbed the ice core data “Dr. Thompson’s thermometer”, thus invoking his stature as a would-be climate scientist to settle, or short-circuit, the debate then underway about whether the records measured temperature or precipitation. (Alas, the IPCC later decided they were precipitation.) Another debate that might have gotten underway at the time, had climate science been the sort of field where important questions are debated even after Al Gore has pronounced on them instead of one that says consensus, consensus where there is no consensus, concerned whether Dr. Thompson’s thermometer was (a) misdated and (b) upside down, thus proving the opposite of what Gore claimed. In 2018 Stephen McIntyre of ClimateAudit fame wrote a post summarizing important research showing both were likely true, but then he forgot to post it so it just appeared online. Since Thompson’s ice core series had been published, a lot of other authors have collected cave speleothem records from nearby areas in China, which showed a consistent picture of warming into the mid-Holocene and cooling thereafter. So in fact the Thompson isotope record lines up perfectly… but only after correcting the dating and flipping the series over. Which is kind of important to the story.
As is the fact that ice cores aren’t actually thermometers that measure temperature directly. Instead they are used as proxies for temperature because their layers contain chemical traces in the form of oxygen isotopes that can be interpreted as temperature or precipitation indicators if there is a formula to convert them. (For instance under warmer conditions more of the heavier isotopes supposedly evaporate from the oceans then descend as rain.)
The theory as told by Thompson is that in polar regions cold weather depletes certain oxygen isotopes, so Thompson applied a lower-means-colder formula to his Chinese ice cores. And the data he presented (graphically) started very low and gradually came up reaching its peak at the present time, apparently indicating relentlessly rising temperatures. But it was always fishy, because it had a weird and very dilated time axis, with an unexplained gap about 1,000 years ago, and axis labeling in which he stretched the start of the record back to the middle of the last glaciation some 40,000 years ago, coinciding with the lowest point in the record. And you might wonder when the data series really starts, but ice cores don’t come with dates attached. Instead researchers have to assign dates to the length intervals and they can use a lot of guesswork in the process.
Here’s his resulting “Gotcha!” chart:
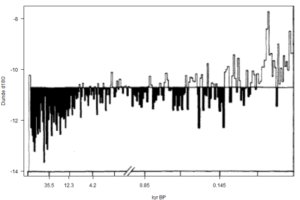
Now the horizontal axis supposedly measures time in thousands of years BP, as in “Before Present”. But note that the last quarter of the graph covers the most recent 145 years while the other three quarters supposedly covers the prior 40,000 years. But it was a guess to place the supposed cold interval well into the last glaciation. And apparently not a good one.
Meanwhile, cave speleothems collected by others from nearby regions indicated that monsoon rains were very heavy during the mid-Holocene. Multiple records from regions surrounding the location of one of Thompson’s key ice cores (Dunde, China) all show the same pattern. And they are also based on oxygen isotopes but the scientists who work with them argue that in monsoon regions depletion of the isotopes is associated with warming not cooling, the opposite of what happens in polar regions. If so, then maybe the right way to view Thompson’s chart is upside down, with the series starting in the warm mid-Holocene, but that would mean current values were relatively cooler.
Evidence for this interpretation came in the form of a remarkable admission by Thompson in 2005, before Gore’s 2006 movie but absent from it, that carbon dating of plant fragments at the base of the Dunde ice core placed its earliest ice formation at around 6,240 years ago in the mid-Holocene, not 40,000:
“Re-examination of the Dunde d18O record in light of the recent d18O histories from Dasuopu and Puruogangri, coupled with a single 14C AMS date of 6240+/- 330 cal. yr BP from near the ice–bedrock contact, raises the possibility that this glacier may also be a Holocene deposit.”
Oops. So the X axis on the graph should start 6,000 years ago during a well-established warm and wet period. In which case the “cold” readings have to be warm and vice versa.
Yup. In a 2012 paper a group of Chinese, American and European scientists noted that if the original Thompson record is compressed so it starts in the mid-Holocene and flipped over, voila, it fits the other records. Gore’s graph was – what’s the word? – oh yes. Rubbish.
Dr. Thompson’s thermometer wasn’t a thermometer. It was, if anything, a rain gauge. It had the wrong time scale. And it didn’t show warming over the millennia but more overall cooling. And while the original error got worldwide publicity including being shown to school children everywhere, in some unhappy cases repeatedly year after year, the correction slipped quietly into the literature without so much as a single word to the public to alert them.
The alarmist industry spawned by Gore and his movie shares with him the distinction of never saying anything that doesn’t turn out on close inspection to be false. How inconvenient is that pattern?
