
Recently we have discussed the rise in European temperatures (see here and here), conceding that it is real while pointing out that climate models can’t explain it as a response to rising CO2. Instead, scientists have linked it to reduced sulphur pollution and reduced cloud cover and again the latter cannot be ascribed to CO2. And a study published last year, which we did not see at the time, adds remarkable historical context to the situation. Researchers from Italy and Sweden took advantage of the correlation between cloudiness and various paleoclimate proxies associated with rainfall to generate a thousand-year reconstruction of mean cloud cover over the Mediterranean region. They concluded that cloud over was low during the Medieval Warm Period, grew for several centuries until the Little Ice Age, then began declining and is now at the lowest level in the entire record. Thus cloud cover correlates closely with temperature changes in this period unlike, what’s that gas, oh right, CO2. Moreover, as the authors point out, this coincides with a period with some of the most intense solar output, providing a one-two heat punch throughout the region that again cannot be attributed to greenhouse gases. [Read more.]
Since we have been known to wave away paleoclimate reconstructions if we think they are based on nothing more than spurious correlations and data mining, it may seem inconsistent, even opportunistic, to trot out a paleoclimate reconstruction that does suit us. But we’re not anti-proxy provided these indirect indicators are not asked to do more than they can, or tortured until they confess to what the inquisitor wanted all along.
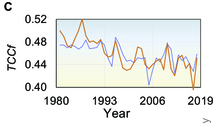
If a meaningful local relationship exists between a paleoclimate indicator, such as tree rings, ocean sediments, cave stalagmites, etc., and a local climate variable, and if the proxy data appears to be sufficiently complete, and properly handled statistically, it certainly can provide vital insight into the past. Where the science goes wrong is when it tries to reconstruct the global climate with such a small sample that it can be twisted into any conclusion you want, or when contrary data get suppressed, or other Mannanigans. In this case, the authors behave appropriately, basing their model on data from 1935 to 1980 then using it to predict cloudiness from 1981 to 2018 so they can compare its output to reliable modern observations. In this crucial test, which many climate models flub embarrassingly, their projection, the orange line, did reasonably well in comparison to the observed “Total Cloud Cover fraction or TCCf (the blue line, obviously):
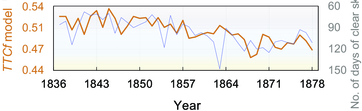
With commendable rigour, instead of immediately shouting “Eureka!” they also looked at a completely independent data set consisting of daily cloud cover observations by a Spanish priest from 1837 to 1878, and found their model (again the orange line) credibly predicted the number of days per year of clear skies he observed (again the blue line):
So having established the credibility of their model and been clear about their methodology in case someone wants to check (as Mann so conspicuously was not) they proceeded to reconstruct average cloudiness in the Mediterranean from AD969 to 2022. The result (and note, please, the grey bars indicating uncertainty, a crucial part of real science strikingly often absent in alarmist charts.) was as follows:
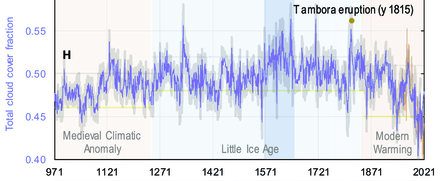
At the start of the record, the Medieval Climatic Anomaly (or Medieval Warm Period) happens to coincide with low cloudiness. Or perhaps it’s no coincidence but effect and cause. Then cloud cover begins to grow and reaches a peak in the late 16th and early 17th century (vertical blue band), after which it begins a steady decline into the modern era, hitting an all time low only recently.
It is quite clear that the big trends in cloud cover coincide with known trends in temperature. And it’s also clear that they weren’t driven by greenhouse gases since they got underway years before our carbon emissions were a thing and one reason people like Michael Mann were so determined to get rid of the Medieval Warm Period is precisely that it does not coincide with an increase in atmospheric CO2, the supposed driver, nor does the Little Ice Age coincide with a decrease in it.
For good measure the authors also show a millennial reconstruction of solar output, oddly enough due to Mann:
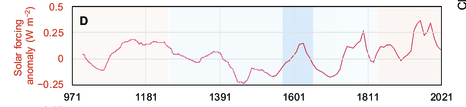
And they point out that the current interval of low cloud cover corresponds with a period of especially intense solar output, which contributes an added surge to surface warming.
The authors of this paper refrain from making a simplistic attribution of cloud changes to greenhouse gases. Indeed it would hardly make sense to do so since so much natural variability long precedes modern emissions. But can current dogma survive if there’s such a strong correlation between clouds and temperature and no plausible causal link between CO2 and clouds or even any correlation?
We say no. As we say this reconstruction adds to the growing evidence that clouds dominate the climate system, by showing a close link between changes in past cloud coverage that coincides with known changes in the Medieval climate.
We will continue to watch this topic carefully. And we challenge the scientists who say to do the same lest they bring their discipline into damaging disrepute.


I’m just an idiot on the Internet in violent agreement with much of what I read. From where I sit it looks like the warming from the LIA was interrupted mid-20th century by the burning of dirtier fuels putting aerosols in the atmosphere, but as that cleaned up and cloud cover continued to decline we resumed the modest temperature climb. Fits the data, fits the facts, fits all like a glove. Very slight assist from co2 but that has much more effect on greening.
We are fine unless the govt insists on destroying the economy.
"It is quite clear that the big trends in cloud cover coincide with known trends in temperature."
Reconstructing cloud cover in the past thousand years based on local proxies is nonsense. The percentage of cloud cover is actually a not very precise proxy for what we really want to know: How much sunlight is the are the clouds blocking?
Both the reduction of air pollution and the reduction of cloudiness would cause daytime warming. But the reduction of cloudiness would also cause cooler nights
In reality nights have been warming faster than days in the past 50 years and the only logical cause for that would be CO2 emissions
The only logical cause? Maybe, Richard, you can give evidence for this "logical cause" that is as strong as the evidence outlined in the article that the researchers used to show they their model was useful in establishing cloud cover levels in the past. Otherwise it looks like nothing but Mannigans.
Given the location of most monitoring stations, the warming nights are likely attributable to the UHI effect. Not
minuscule CO2 emissions.