We’re continuing our look at Chapter 6 of last summer’s DOE Red Team Report, which covers extreme weather trends. (And make sure you look at team member and University of Guelph Professor Ross McKitrick’s recent blog post at Judy Curry’s website in which he dispels some current nasty myths about the project and its current status.) This week we look at trends in US tornadoes, flooding and droughts. These sections are short and to the point, the point being that there are no trends nor do the experts who study them claim there are. If you hear anyone claiming otherwise, ask for the data.
The IPCC says they can’t “robustly” detect trends in US tornadoes due to insufficient long term data. And the DOE team points out that weak tornado events were often missed prior to the 1990s. Tornado strength is measured by the amount of damage done, and if a weak tornado passed through a rural area without damaging anything it may well not have been reported and possibly not even observed. Now, with radar covering everywhere, not to mention cell phones everywhere, any time a funnel cloud forms someone sees it and mentions it so even the weakest tornadoes are logged. But strong to violent tornadoes were always noticed so the count of those should indicate if there are trends. So look at this chart (from the DOE Report p. 67) and you be the judge:
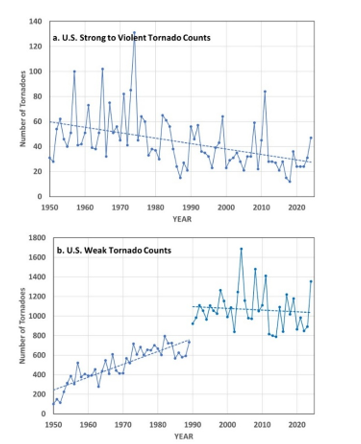
To assist the court in reaching a verdict, the top panel shows that there are fewer strong/violent tornadoes now than prior to 1980. And yes, it also shows that at the same time there was an apparent upward trend in weak tornadoes. But, your Honour, only up to 1990. Once the radar systems were in place the apparent trend disappears, strongly suggesting there were as many tornadoes prior to 1990 but for the reasons listed above, they just weren’t reported.
On the next issue, flooding, the DOE team doesn’t present any pretty pictures (a term here meaning “if you like charts”), just a few quotations from IPCC and NCA reports. The gist of them is that at the global level there is low confidence, which means it’s more likely it didn’t happen than that it did, regarding changes in peak streamflow trends and in the magnitude or frequency of floods. For the US, some areas show increases and some show decreases in flood magnitude but there are no US-wide trends and the data don’t support attributing changes to human influences.
Finally, regarding droughts, the same story emerges. At the global level there are some areas where more droughts have been observed in recent years and one region where fewer have been observed. But in the US, the 1930s were worse than any time since, and the paleoclimate record indicates far worse extended drought intervals in previous centuries. The percentage of the US classified each month as “Very Dry” has declined over 1895 to 2025, according to NOAA. “In summary,” they note “there is no evidence of increasing meteorological drought frequency or intensity in the U.S. or globally over recent decades.” So there you have facts instead of greasy dust from the rumour mill.
Next week: wildfires.


