The US has a lot of long-term weather records, so it’s a good place to study how climate change is making everything hotter. For instance, NOAA defines “unusually hot” weather as a day when the temperature rises above the 95th percentile for that location over 1948 to 2023, meaning it’s in the top 5 percent of days. And what with relentless global warming, unusually hot weather must be becoming more and more common. But why speculate when we can #LookItUp? And we encourage you to do so because if we told you what the record shows without providing evidence, you might not believe us.
This map summarizes the changes by location across the U.S. (click here and select Figure 3):
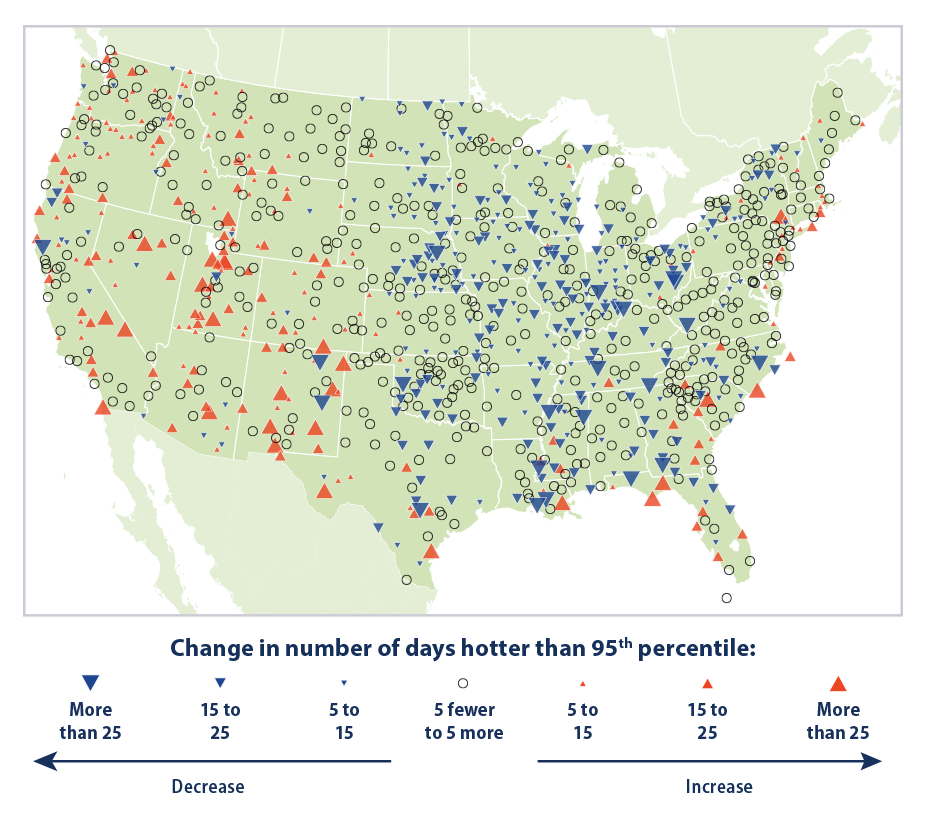
The red up arrows show where unusually hot days are becoming more common and the blue down arrows where they are becoming less common. The open circles are where there is no change. Notice anything? Right. There are a lot more blue arrows than red ones. From 1948 to 2023, unusually hot weather became less common in more places in the US (mainly east of the Rockies) than it became more common. And the average change across all locations is negative. So unusually hot weather is a bit less common now overall.
Which might seem unusual if you get all your information from the alarmist media. But not once you learn that there’s a world of data out there and you know where to #LookItUp.


The plot of temperature trend changes is quite interesting and reveals the regional differences. Overall, far more areas across the entire U.S. with no temperature change trend. That in itself is revealing. The humid US east coast has a few areas with an upward trend while the rest of the east has a downward trend. The dry desert western U.S. has a few areas of upward trend but less than the eastern downward trend. One question immediately comes to mind. Why/how can an area that shows a large increase or decrease in temperature trend be in very close proximity to areas with no change or an opposite trend? It is possible that the point of measurement has been relocated further away from urban areas where the trend is downward but with so many areas of no change, does it matter? Studies have shown that when only non urban temperature stations are used, the increase in U.S. temperature is small.