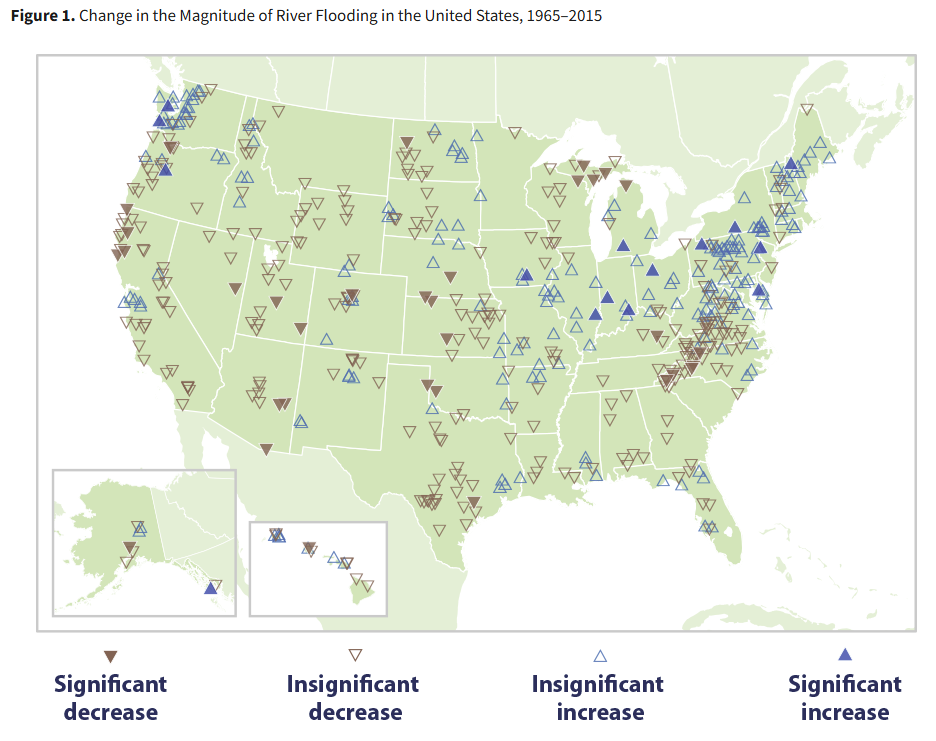
As we somehow survive another spring flood season unwashed-away, we are reminded of the nonstop nightmare of climate change making floods bigger and more frequent, except where they are becoming smaller and less frequent. Like in the US. And how do we know? Because it turns out there is data and you can #LookItUp on the US Environmental Protection Agency website. Flood magnitude and frequency went up from 1965 to 2015 at many locations in the Northeast, but down over most of the rest of the US, and the overall average was down on both measures.
Here is the map showing change in flood magnitudes. The blue arrows (increasing) are clustered in the Northeast, the Pacific Northwest and a few Midwest areas. Everywhere else it’s down, and a quick check of the underlying data (available at the same site) confirms that the overall average is downward:
The map showing flooding frequency looks very similar:
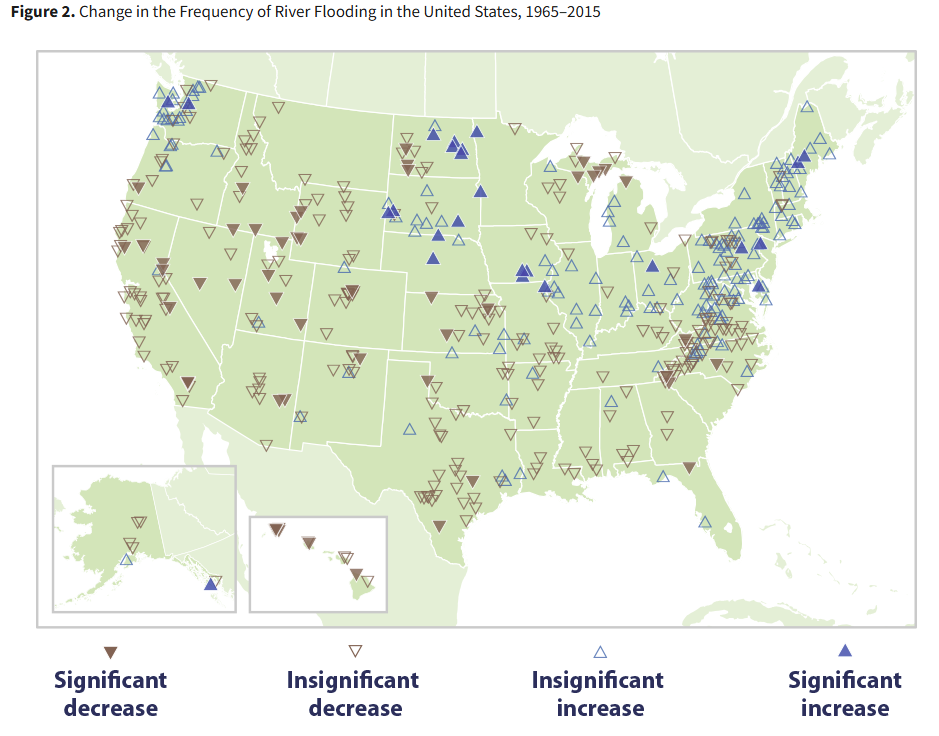
Up in the Northeast, Pacific Northwest and a few Midwest areas and down everywhere else. And down overall on average.
Actual floods are no fun and to anyone who had to deal with one this year we send our sympathies. But to anyone who had to deal with a flood of alarmist claims that climate change is causing larger and more frequent real ones, we send data and we encourage you to #LookItUp.


Dollars to donuts the reason the northeast had increased flooding is because of landform changes, paving all those expanding settled areas, the same rainfall means bigger floods.
Bank on it
Up, down, sideways and whatever. Many climate and weather related things change over time then maybe change back. But I won't go for either the dollars or the donuts nor the bank regarding landform changes. Sure they have an impact but why only in the northeast would they be causing increased flooding.