Our second stop on the CDN tour of seaside destinations in search of rising sea levels takes us to the city of Victoria, on the southern tip of Vancouver Island with the mighty Pacific Ocean lapping at its shores. Victoria, capital of the Canadian province of British Columbia, is what passes for a warm-weather holiday destination in Canada. And when you see this chart of Victoria’s annual mean sea level since 1980 you will understand why the government of British Columbia has long been on the vanguard of climate alarmism in Canada. Or not.
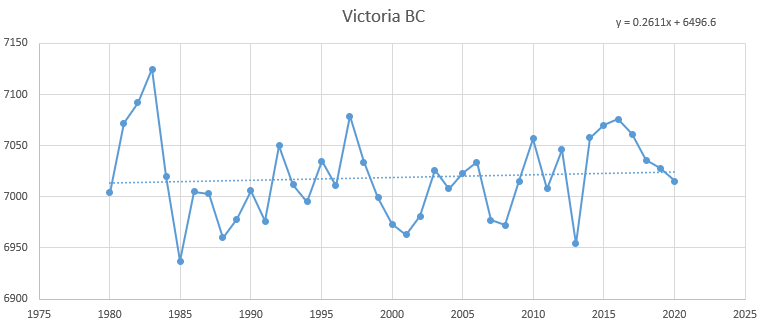
Over the past 40 years the sea level at Victoria has risen by about 0.26 mm per year, at which rate it will take about 3,830 years to rise one meter. Assuming the next ice age doesn’t happen first.
If you’re one of those short-sighted people who thinks in terms of centuries rather than millennia, over the next 100 years the sea level at Victoria will rise by about 2.6 centimeters, which on the San Juan Islands just east of Victoria would be one inch. And if you think one inch of seawater is an existential threat, you shouldn’t be living near the shore. Or arguably without adult supervision anywhere.
P.S. As always for this series our data source is the Permanent Service for Mean Sea Level in Liverpool UK.


If the west coast existential threat, a real and more existential threat is the next Cascadia mega thrust which will devistate Vancouver Island and cause extensive damage in the Lower Mainland. There has been no rapid escalation in Seawater rise and remain skeptical this will happen. Regardless, they the municipal government is likely going to raise the sea walls in Delta where I live.
Looking at the graph, I'd say that there is a large standard error around your trend line of 0.26mm/yr. Which gives the estimate "medium confidence" (to use the IPCC term) of being anywhere close to being realistic.
The graph covers 40 years. We could do what the greenies do, and start at 1985 and stop at 2016 to show that the sea is rising rapidly. Or we could take that page from their playbook and start at 1983 and stop at 2013 to show a large drop in sea level. They have done this with temperature readings, being sure to start around 1960 instead of, say, 1920. Or 1890. Don't want those terrific heatwaves of the '30s and '50s to wreck the narrative, do they?