Speaking of climate change as a religion-like object, it is an article of faith among alarmists that the weather is getting worse. Spectacularly worse, in fact. They chant it regularly as a ritual observance, premise not conclusion, as in a typical item from Bloomberg Green that says “Home insurance is essential for recovering after disaster hits. But, as an increasing number of homeowners are finding out, payouts may not be enough to rebuild. Today’s newsletter looks at what can be done to help bridge the growing gap at a time when extreme weather is worsening.” Now we’ve dealt with the insurance issue elsewhere, and will again. But what of this dogma that extreme weather is worsening, driven by surging temperatures? Well, the numbers coming in for 2025 show that temperatures were high but not as high as 2024, landfalling hurricanes were strictly average and gave no sign of a trend upwards, and weather disasters worldwide likewise refused to trend up, even heatwaves. It’s time for the climate movement to declare a credibility emergency.
For the temperature data we turn to Roy Spencer’s blog where he shows the final 2025 lower troposphere satellite temperature record. 2025 was the second warmest year in the record, but well below 2024 as the climate system expels excess heat built up over the previous two years:
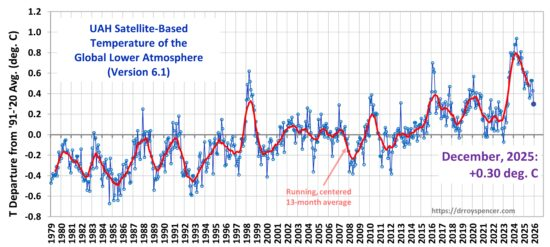
What caused the warming spike in 2023? As we discussed last week, the Hunga Tonga volcano might be the culprit although climate modelers say nay. Or maybe it was a really strong El Niño, which ends up being another way of saying the warming was caused by a lot of warming. The main point is whatever caused it was temporary and 2025 brought the world back to its gently warming trend. So not a relentless surge in CO2 driving a relentless surge in temperature.
Next, the hurricane numbers, courtesy of Roger Pielke Jr. who has updated his annual data series showing tropical cyclone landfalls at hurricane strength:
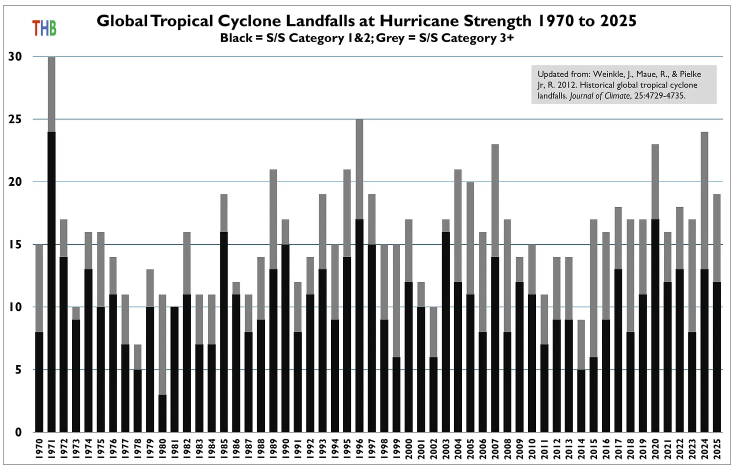
The black bars show Categories 1 and 2, the gray bars show Categories 3 and up, and the height of the bar shows the total which in 2025 was 19 for the year, of which 13 were in the Western North Pacific, one was in the North Atlantic, and five were in the Indian Ocean.
Running trends through the black and gray groups separately would show that there is no trend in the weaker storms and an upward trend in the stronger storms, so there is an upward trend in the proportion of storms making landfall at higher intensities. But, Pielke Jr. notes, these data only go back to 1970. Prior to that there weren’t enough observations of small cyclones over some of the world’s oceans to be sure of the counts. In two regions the data are reliable back to 1950: the Western Pacific and the North Atlantic, which account for about 70 percent of global tropical cyclone activity. Those numbers look like this:
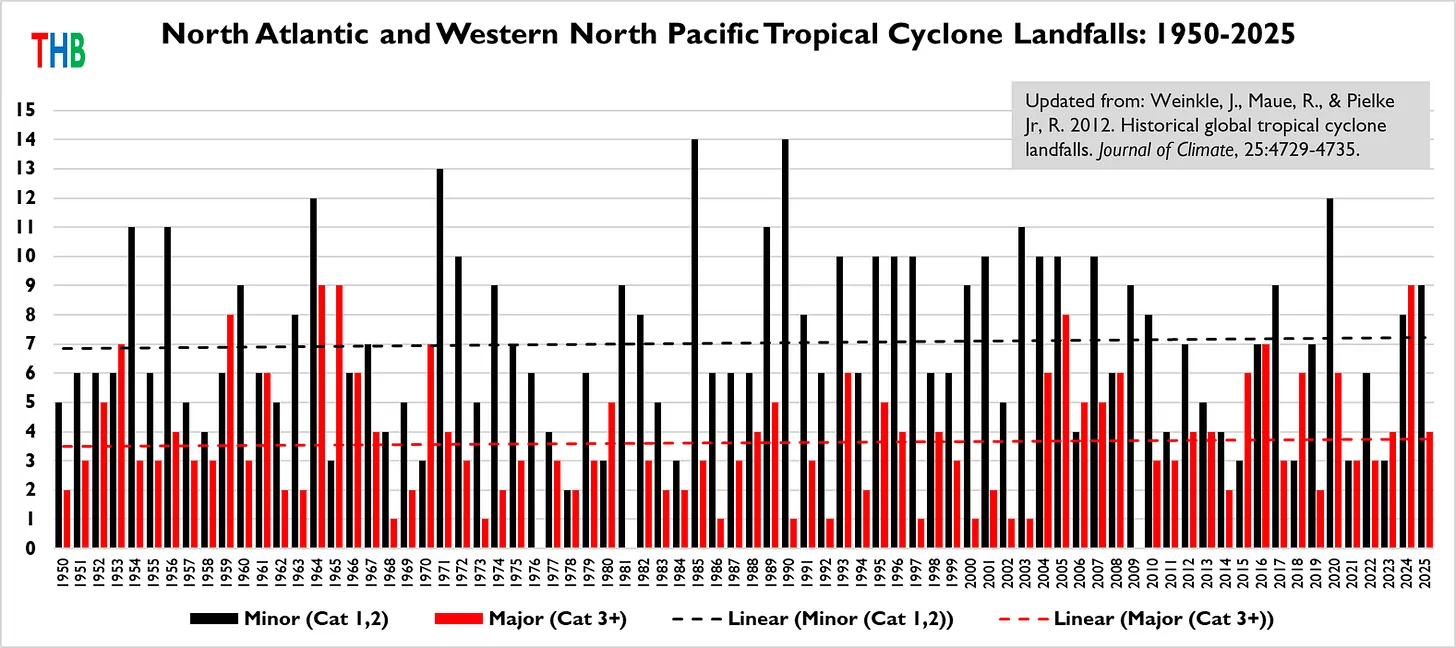
Neither minor nor major storms exhibit a trend. Instead the major storms go through a lull in the 1970s. So a data set starting in 1970 will show a trend. If that effect applies to the remaining ocean basins it is safe to conclude that all we have seen in the data since 1950 is natural variability but no trend in either type of hurricane. 2025 continues that pattern: just another average year. So no relentless surge in bad weather driven by the non-surge in temperature.
Finally, Matthew Wielicki presents the 2025 global Emergency Events Database numbers from the Centre for Research on the Epidemiology of Disasters (CRED) in Belgium. And 2025 is below average despite the heat. In fact it’s the lowest disaster count on record:
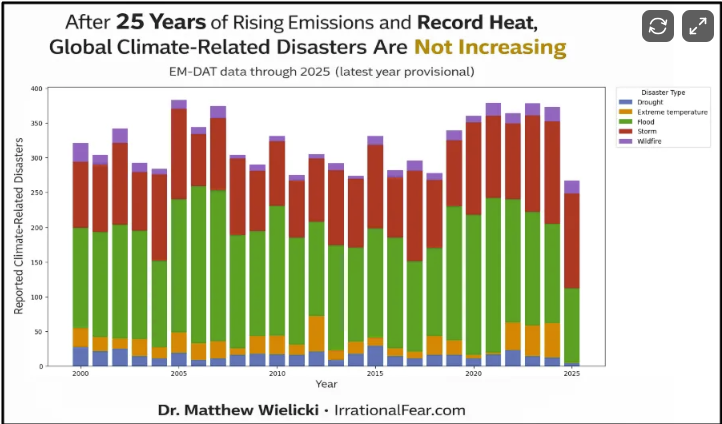
As Wielicki notes the data are provisional and may be revised upward a bit. But even so the outcome will be a bust for the Climate Emergency crowd. No surge in deaths due to the non-surge in bad weather driven by the non-surge in temperature. Gol durn it, what do you have to do to get killed by “carbon pollution” around here?
Wielicki notes the striking absence in the chart of extreme heat events. There was one, but it’s hard to see due to the scale. Incidentally CRED doesn’t take note of days that are merely hot or even uncomfortable, it only counts days when temperatures exceeded a threshold and cause tangible impacts including mortality or displacement. Most years there are a dozen or more such events. And last year there was just one. Drought events were also way down.
In presenting the data Wielicki notes that the threat of weather extremes and disasters has for years been the number one talking point from climate alarmists. It’s not just buffoons like Al Gore. Major political and scientific institutions including NASA, NOAA, the IPCC and the UN have all stated with absolute certainty that global warming means more extreme weather disasters and most assert ritualistically that those disasters are indeed battering us. As Wielicki notes: “This is the backbone of climate crisis messaging.” But the numbers aren’t there, and never have been.
So 2025 was a bust for those hoping to see a climate emergency, and 2026 is shaping up to be an even bigger bust for promoters of the climate alarmist policy agenda. Good news all around. But don’t look for them to be popping corks… or for the legacy media to mention it at all.


